H₂S Levels: Why High-Pressure Samples Don't Tell the Full Story
Category > Oil and Gas
May 06, 2024H₂S (hydrogen sulfide) measurement is crucial in process engineering for several reasons: 1) regulatory compliance, 2) personnel safety, and 3) maintaining equipment integrity. Different safety and environmental standards protect both people and the environment, and costs associated with equipment damage vary based on the ppm levels of H₂S, making accurate measurements essential.
One problem I've noticed in the energy industry is the assumption that gas sample lab analysis from one pressure point remains representative at other pressure points. For example, operators often take the 20 ppm H₂S value measured from the primary pressurized separator (typically operating between 100–1000 psig), and re-use it for vapor recovery applications, which usually operate at near 0 psig. At this lower pressure, the H₂S ppm can rise to 63 ppm due to phase behavior changes. A model simulating such a facility is shown in Figure 1 below.
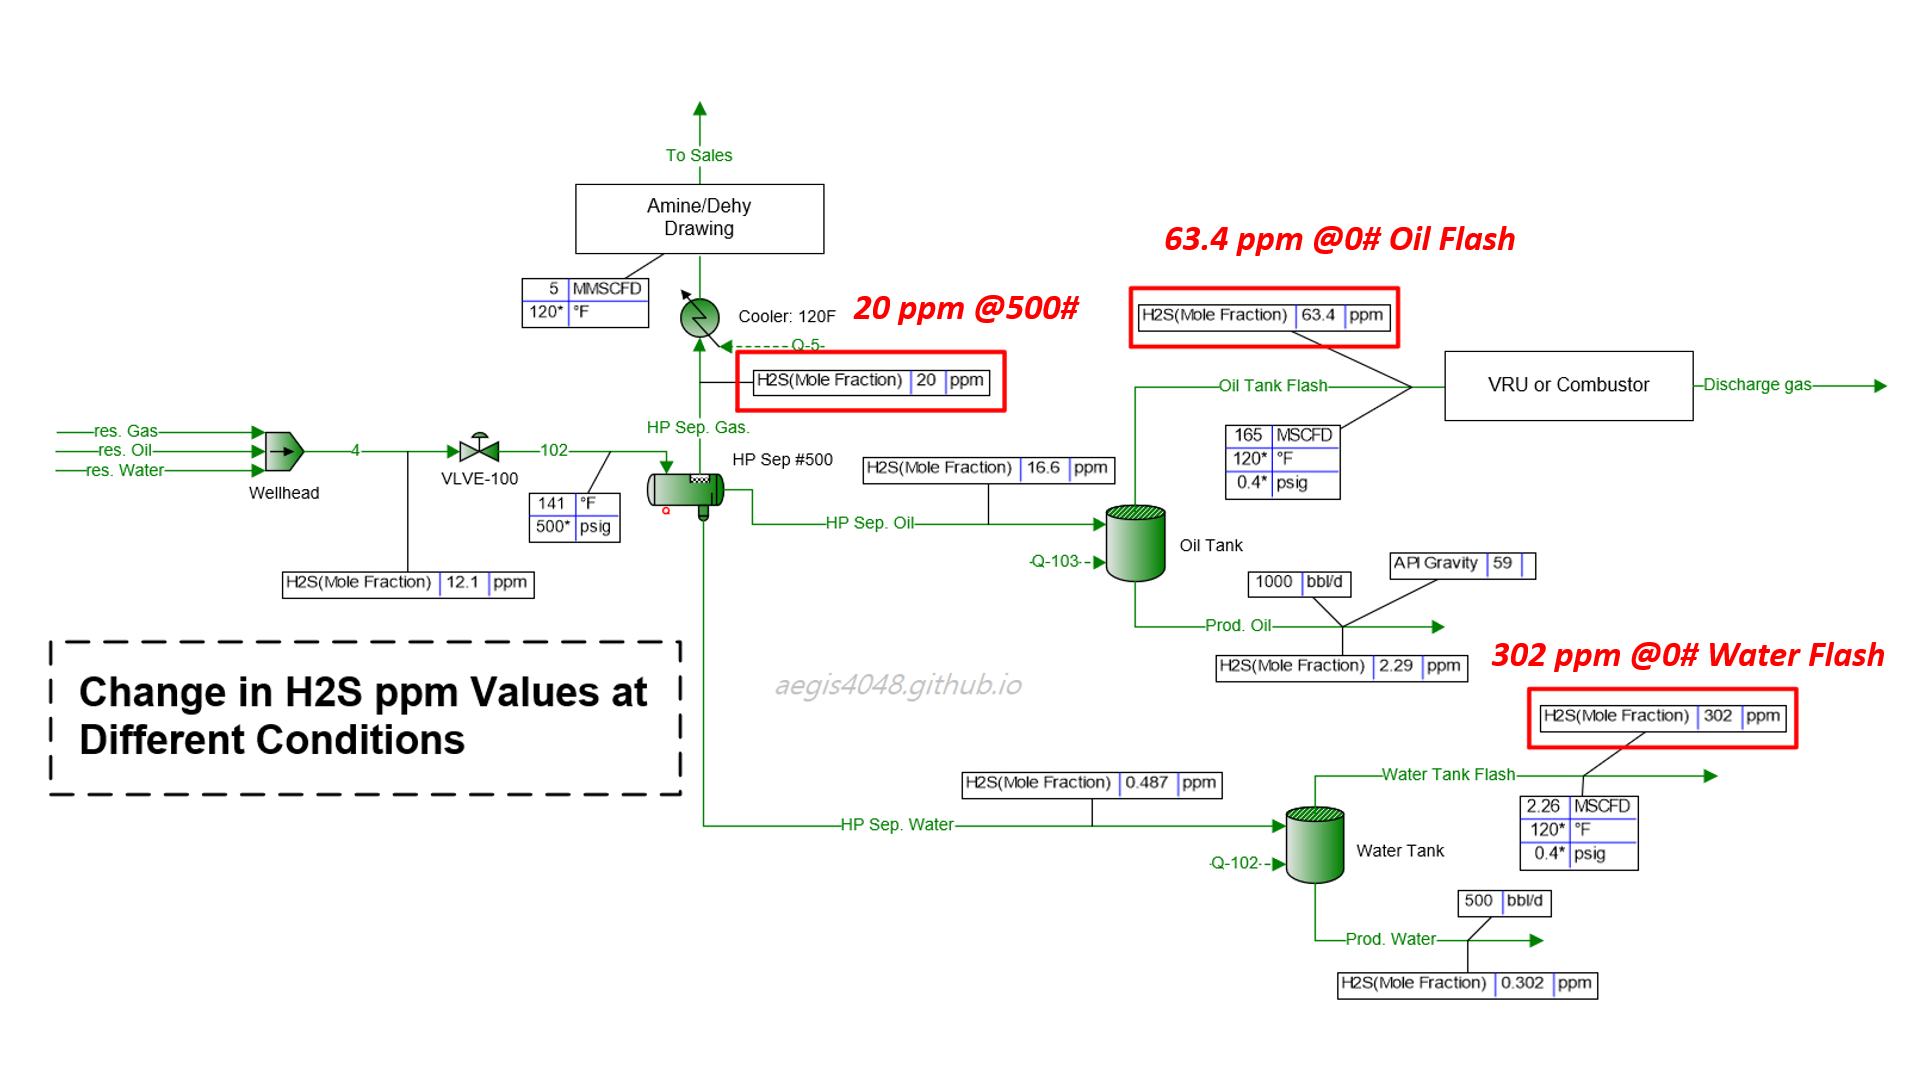
Figure 1: A model of a typical upstream oil and gas facility, simulated with BR&E Promax. The heater treater is omitted for simplicity (as it doesn't significantly affect downstream conditions, with temperatures high enough to break emulsions in this case). The middle-left vessel (HP Sep #500) is the primary separator, operating at 500 psig and 141°F. The flash gas line (HP Sep. Gas) from this separator reports 20 ppm H₂S, which is higher than the typical 16 ppm midstream requirement and may require sour gas treatment. However, the gas line (Oil Tank Flash) from the oil tank, operating at 0.4 psig, shows 63.4 ppm H₂S. The H₂S value triples at the lower pressure, demonstrating that reusing the 20 ppm value measured at the HP separator for VRU or combustor applications would be inaccurate. This issue is even more severe for the water tank vapor (Water Tank Flash), which reports 302 ppm H₂S. In Oklahoma, according to subsection (c) Storage tank provision of Okla. Admin. Code § 165:10-3-16, this requires installation of a warning sign, wind indicator, and fencing. Additionally a flare, vapor recovery, or H₂S stripping system is required.
1. Why does H₂S ppm levels matter?¶
1.1 Regulatory Compliance¶
In Oklahoma, Okla. Admin. Code § 165:10-3-15 - Venting and Flaring provides guidelines on when operators can vent or flare gas, depending on the situation. However, in all cases, if H₂S levels exceed 100 ppm, venting is prohibited, and the gas must be flared. It cannot be vented through storage tank thief hatches. This rule applies to scenarios such as initial flowback periods for newly completed or recompleted wells, exploration wells, etc.—all must be flared. The only exception is when the gas to be flared is not of pipeline quality, and this exception can only last for up to 45 days.
Okla. Admin. Code § 165:10-3-16 - Operation in hydrogen sulfide areas applies to upstream facilities with H₂S levels above 20 ppm. Notably, Subsection (c) requires measuring H₂S concentration 1-ft above the open thief hatches of atmospheric storage tanks. If levels exceed 100 ppm, warning signs, wind indicators, and fencing are required. Additionally, a flare, vapor recovery, or H₂S stripping system must be installed. In Figure 1 above, the H₂S ppm level is triple of the 100 ppm threshold, and will most likely need to be monitored. Also, subsection (h) mandates that flaring equipment in public areas be made from hydrogen sulfide stress cracking (HSSC) resistant materials. Material selection guidelines for HSSC resistance can be found in NACE MR-0175/ISO 15156.
In Texas, the Texas Railroad Commission (RRC) considers oil and gas operations with H₂S levels exceeding 100 ppm as sour gas operations and imposes safety and regulatory requirements (RRC Statewide Rule 36). On the other hand, the Texas Commission on Environmental Quality (TCEQ) defines sour gas as above 24 ppm and imposes additional restrictions beyond those required by the RRC. The RRC focuses on the safety and operational integrity of oil and gas facilities, while the TCEQ emphasizes air emissions control.
1.2 Equipment Damage¶
Natural gas pipeline companies require H₂S levels to be below 4–16 ppm (depending on the operator) and impose fees if these levels are exceeded to protect their pipelines from damage. Similarly, compressor rental companies also set limits on H₂S concentrations to prevent corrosion and protect their equipment. These thresholds are typically outlined in pipeline or equipment rental specifications.
1.3 Personnel Safety¶
Occupational Safety and Health Administration (OSHA) sets three standards based on ppm limits (note that OSHA ppm measurements are based on air sampling in the work environment, not inside a process stream):
2. H₂S measurement practices in upstream Oil and Gas¶
H₂S measurements in upstream production facilities are rarely done using air detection devices. Typically, a gas sample is taken from a primary pressurized separator, usually operating between 100~1000 psig. The main purpose of this sample is to ensure compliance with gas pipeline specifications (such as water content, H₂S, CO₂, and N₂ levels) and to determine the fair price of the gas, with higher energy content leading to higher value. The sample is sent to a lab for compositional analysis.
If the operation engineer has concerns about H₂S levels, based on offset well experiences, they may request the lab to specifically report H₂S concentrations at an extra cost. Some labs include this for free, while others charge for it. Often, H₂S is not reported in the standard lab analysis. When asked to provide H₂S ppm numbers, sometime they get a nearby offset well sample analysis that includes H₂S numbers, and report it instead of the actual well they are working on and call it good (which can be, of course, largely inaccurate). Figure 2 shows a real lab sample where H₂S composition is reported, and Figure 3 illustrates a case where H₂S was omitted.
When H₂S ppm levels are reported by the lab, operators use this information to comply with regulations and meet pipeline and equipment rental specifications. However, issues arise when H₂S ppm values obtained from a pressurized vessel (operating between 100–1000 psig) are applied to atmospheric applications like storage tanks or vapor recovery systems. H₂S concentrations at near-atmospheric pressures can be significantly higher than those measured in high-pressure vessels.
Figure 1 above illustrates this issue, showing a case where 20 ppm H₂S is reported at a 500 psig separator gas line, but 63.4 ppm and 302 ppm are reported in the gas lines of oil and water storage tanks at 0.4 psig, respectively.
I witnessed a similar issue at a gas compressor rental company. Operators provided H₂S measurements of 10–15 ppm, but our rental equipment suffered damage consistent with much higher concentrations. Initially, our account managers suspected the customer was either lying or mistaken. However, as this problem occurred repeatedly, they asked me to model the facility and simulate H₂S at the compressor inlet. My analysis revealed that H₂S ppm values measured at high-pressure separators are not representative of atmospheric applications. As pressure decreases, lighter hydrocarbons like methane and ethane preferentially flash off more quickly than H₂S, leading to an increase in H₂S concentration as the lighter components escape first. Detailed explanation of this phenomenon is provided below.
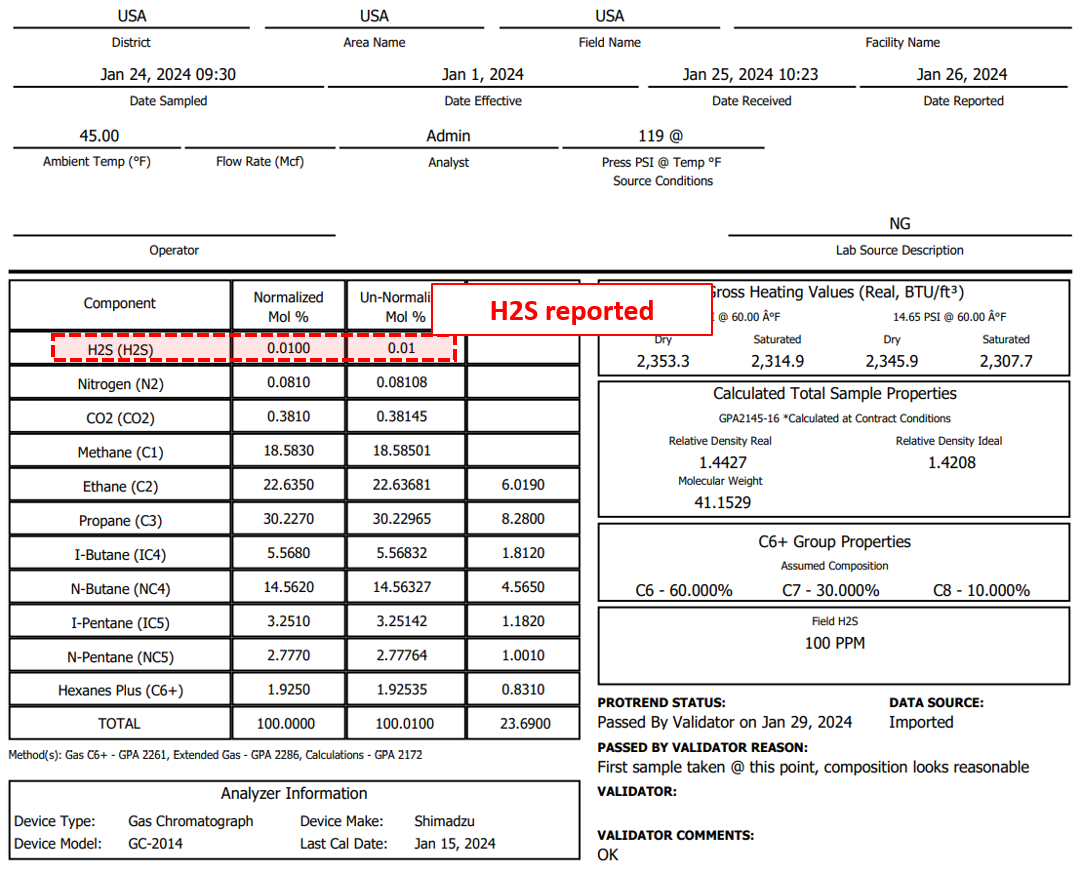
Figure 2: Gas sample analysis from VRU pulling flash gas from upstream atmospheric oil tanks, reporting 0.01% mol frac = 100 ppm H₂S. This is right on the 100 ppm H₂S limit set by Okla. Admin. Code § 165:10-3-15 and cannot be vented.
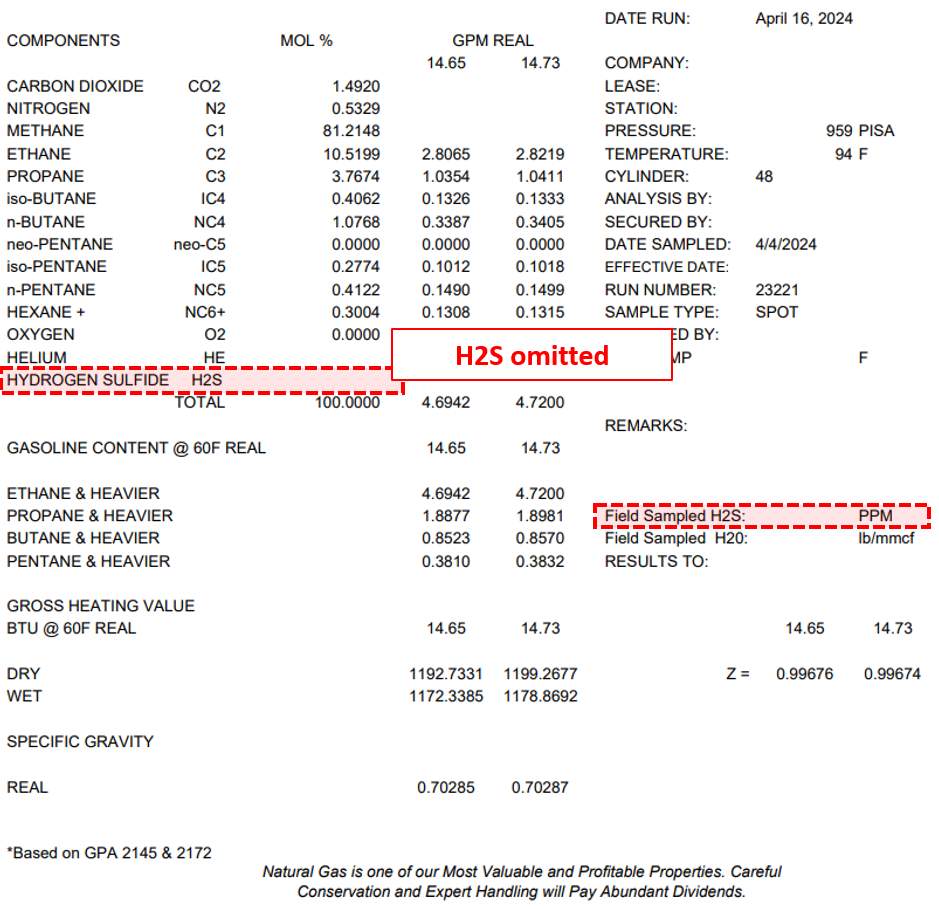
Figure 3: Example of a gas analysis from a primary HP separator operating at 959 psia. Although the lab offers an option for H₂S analysis, it was not measured as the customer opted not to pay extra for it.
3. Understanding phase behavior of H₂S and hydrocarbons¶
During oil and gas phase separation and distillation processes, compounds with smaller molecular weights, known as "light-ends," tend to flash off into the gas phase before the "heavy-ends." The exact classification of light-ends versus heavy-ends can vary depending on the context, but for this article, I will use these terms to compare the relative weights of compounds.
Figure 4 below shows a simulation of reservoir fluid being sequentially separated into gas and liquid phases through 3-stage separation (500 psig, 200 psig, and 0 psig). The fraction of methane, the lightest compound, in each vessel’s gas line sequentially decreases as the 2-phase fluid moves through lower-pressure vessels. Light-ends flash off into the gas phase much faster than heavy-ends. By the time the process stream pressure reaches atmospheric level (0 psig), a significant portion of the light-ends has already escaped in the previous separators, leaving behind a higher concentration of heavy-ends. This also increases the concentration of H₂S because H₂S is heavier than methane and other light-ends have already flashed off.
Table 1 shows the compositional changes in percentage between the 500# flash gas and the 0# flash gas. It also highlights that not only does the absolute fraction of heavy-ends increase relative to light-ends, but the magnitude of such increase is more pronounced for heavier compounds. For example, ethane (MW = 30.07) fraction increased by 376.4%, whereas pentane (MW = 72.15) saw a dramatic 1932% increase.

Figure 4: Simulation of an upstream facility where reservoir fluid is separated through a series of 3 vessels, modeled using BR&E Promax. The reservoir fluid composition reflects real well fluid properties. Initially, the fluid enters the primary separator at 500 psig, with methane making up 87.3% of the gas line, decreasing to 70.3% and 25.5% in downstream separators as pressure drops. Meanwhile, the concentration of heavier compounds increases due to the reduction of methane. Note the rising energy content (Btu/ft³) and H₂S ppm levels as separator pressures decrease. The H₂S level increased from 18.8 ppm at the high-pressure separator to 129 ppm (a 6.86-fold increase) in the atmospheric tank. This demonstrates that H₂S ppm levels measured at high pressure cannot be directly applied to low-pressure applications.

Table 1: Comparison of compositional changes at the 500 psig separator vs. the 0 psig atmospheric tank gas line. Methane fraction decreased as it flashed off first, increasing the concentration of heavier-ends. The magnitude of the change correlates with each compound's molecular weight, with heavier compounds showing greater changes.
3.1. Flash Point Pressure¶
Why do light-ends flash to gas before heavy-ends? It’s because the flash point pressure of light-ends is higher than that of heavy-ends. Figure 5 shows the flash point curves of six pure compounds. If the pressure and temperature are to the left of a compound’s curve, it exists as a liquid; if to the right, it exists as vapor.
Take ethane (orange) as an example. At 80°F, the flash point pressure of ethane is 618 psig. At the same temperature, propane's (red) flash point pressure is 131 psig, which is lower than ethane. Now, assume these two compounds are in the same system (but exist as independent pure compounds) at the same temperature of 80°F (illustrated by the vertical dashed grey line), and the pressure changes from 620 psig to 300 psig and then 100 psig. At 620 psig, both compounds are in liquid form. As pressure drops to 300 psig, ethane will vaporize while propane remains liquid. When pressure drops further to 100 psig, pressure is below both compounds' flash curves, and both will vaporize. This occurs because ethane's flash point curve is higher than propane's, meaning ethane vaporizes first.
Looking at the figure, you’ll notice that the lighter the compound, the higher its curve, illustrating why lighter compounds preferentially flash to vapor more easily than heavy-ends. The flash point curve of H₂S is located below (or to the right of) methane and ethane, which explains why methane and ethane vaporize more easily than H₂S.
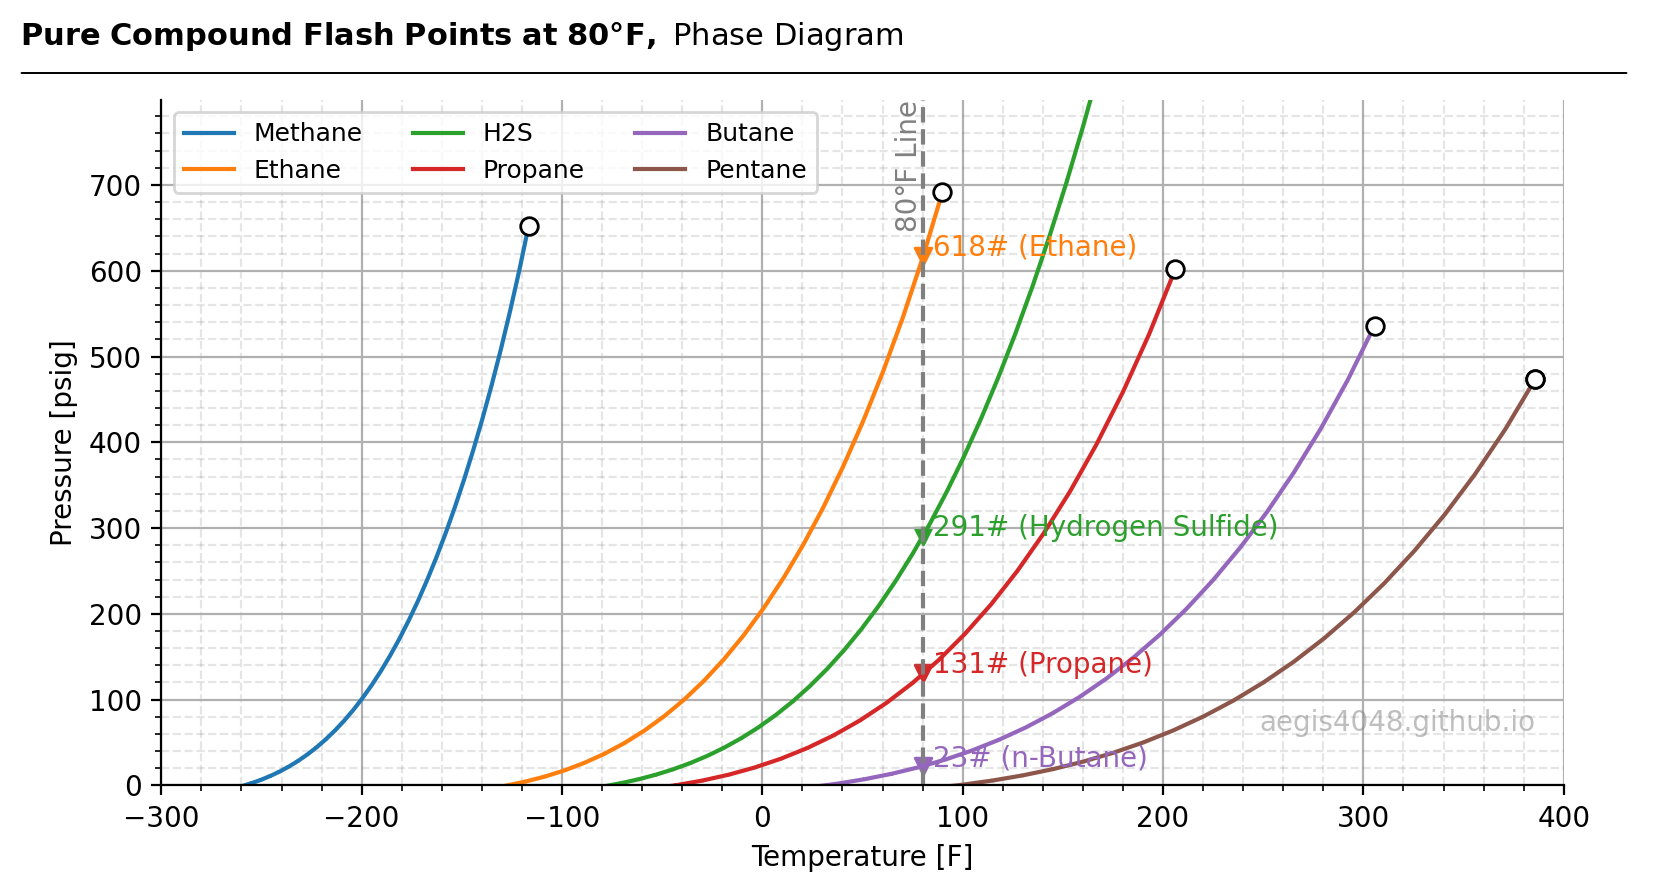
Figure 5: Flash point curves of pure compounds, calculated and generated using Python. Circular markers indicate critical points. Note that the critical point of H₂S extends far outside the plot at 1285 psig and 213°F (not shown), showing a different pattern from the hydrocarbon compounds. This is because H₂S does not contain a carbon atom and, therefore, does not fully follow the characteristics of hydrocarbons. The grey dashed line shows the 80°F isothermal temperature. Downward-triangular markers indicate flash point pressures of various compounds along the 80°F line. However, the 80°F isothermal is located far right of methane's flash curve, meaning it does not intersect. This indicates that methane will always be in a vapor phase, regardless of the pressure, until the pressure is below its critical pressure, after which methane enters a critical phase.
Source Code For Figure (5)
import CoolProp.CoolProp as CP
import matplotlib.pyplot as plt
import numpy as np


def Pa_to_psi(pa):
    return pa / 6894.745

def K_to_F(K):
    return (K - 273.15) * 1.8 + 32

components = ['Methane', 'Ethane', 'H2S', 'Propane', 'Butane', 'Pentane']
comp_dict = {comp: {} for comp in components}
for comp in components:
    HEOS = CP.AbstractState('HEOS', comp)
    HEOS.set_mole_fractions([1])
    HEOS.build_phase_envelope("dummy")
    PE = HEOS.get_phase_envelope_data()
    comp_dict[comp]['Ts'] = np.array(sorted([K_to_F(item) for item in PE.T]))
    comp_dict[comp]['Ps'] = np.array(sorted([Pa_to_psi(item) - 14.7 for item in PE.p]))

T_unit = 'F'
P_unit ='psig'

fig, ax = plt.subplots(figsize=(8, 4.5))

for comp in components:
    ax.plot(comp_dict[comp]['Ts'], comp_dict[comp]['Ps'], label=comp)
    ax.scatter(comp_dict[comp]['Ts'][-1], comp_dict[comp]['Ps'][-1], s=40, edgecolor='k', fc='white', zorder=3)

ax.scatter(comp_dict[comp]['Ts'][-1], comp_dict[comp]['Ps'][-1], s=40, edgecolor='k', fc='white', zorder=3)
ax.axvline(x=80, color='grey', linestyle='--')

ax.set_xlabel('Temperature [%s]' % T_unit)
ax.set_ylabel('Pressure [%s]' % P_unit)

ax.grid(True)
ax.spines['top'].set_visible(False)
ax.spines['right'].set_visible(False)
ax.set_xlim(-300, 400)
ax.set_ylim(0, 799)

ax.legend(ncol=3, fontsize=9, loc='upper left')

x_increment = 5
ax.text(73, 799, '80°F Line', fontsize=10, ha='center', va='top', color='grey', rotation=90)

ax.text(80 + x_increment, 617.64, '618# (Ethane)', ha='left', c=plt.rcParams['axes.prop_cycle'].by_key()['color'][1])
ax.text(80 + x_increment, 291.29, '291# (Hydrogen Sulfide)', ha='left', c=plt.rcParams['axes.prop_cycle'].by_key()['color'][2])
ax.text(80 + x_increment, 130.64, '131# (Propane)', ha='left', c=plt.rcParams['axes.prop_cycle'].by_key()['color'][3])
ax.text(80 + x_increment, 22.52, '23# (n-Butane)', ha='left', c=plt.rcParams['axes.prop_cycle'].by_key()['color'][4])

ax.scatter(80, 617.64, marker='v', c=plt.rcParams['axes.prop_cycle'].by_key()['color'][1])
ax.scatter(80, 291.29, marker='v', c=plt.rcParams['axes.prop_cycle'].by_key()['color'][2])
ax.scatter(80, 130.64, marker='v', c=plt.rcParams['axes.prop_cycle'].by_key()['color'][3])
ax.scatter(80, 22.52, marker='v', c=plt.rcParams['axes.prop_cycle'].by_key()['color'][4])

ax.minorticks_on()
ax.grid(axis='both', which='minor', color='grey', linestyle='--', alpha=0.2)

ax.text(0.98, 0.08, 'aegis4048.github.io', fontsize=10, ha='right', transform=ax.transAxes, color='grey', alpha=0.5)
def setbold(txt):
    return ' '.join([r"$\bf{" + item + "}$" for item in txt.split(' ')])


bold_txt = setbold('Pure Compound Flash Points at 80°F, ')
plain_txt = 'Phase Diagram'
fig.suptitle(bold_txt + plain_txt, verticalalignment='top', x=0, horizontalalignment='left', fontsize=11)
yloc = 0.9
ax.annotate('', xy=(0.01, yloc + 0.01), xycoords='figure fraction', xytext=(1.02, yloc + 0.01),
            arrowprops=dict(arrowstyle="-", color='k', lw=0.7))


fig.tight_layout()
Notes: Mixture behavior
Assume a 50:50 mol fraction binary mixture of ethane and propane at 80°F. In this case, they are mixed, not existing as independent pure compounds. The mixture starts at 1000 psig as 100% liquid. Now, drop the pressure to 300 psig, which is below ethane's flash point but above propane's. Would the mixture be a 2-phase fluid? Yes. However, does this mean the vapor fraction is composed of 100% ethane? No.
When compounds are mixed and the pressure drops, it doesn't work as if all of the lighter compounds vaporize first, and then, once the pressure drops further, the heavier ones vaporize later. It doesn't work like that. Both compounds vaporize together, but the lighter compound preferentially vaporizes more than the heavier one.
Running such a simulation in BR&E Promax, one can find that at 80°F and 300 psig, the mixture forms a 2-phase fluid with 35.4% vapor and 64.6% liquid. The vapor phase (35.4%) is composed of 64.8% ethane and 35.2% propane. The liquid phase (64.6%) is composed of 41.9% ethane and 58.1% propane. This distinction needs to be clarified.
3.2. H₂S ppm level changes in vapor vs liquid¶
H₂S ppm levels are typically more problematic in the gas phase because concentrations are higher there than in the liquid phase. As shown in Figure 6, H₂S levels in the gas phase are consistently higher than in the liquid phase. Additionally, as the reservoir fluid undergoes separation at decreasing pressures, H₂S ppm in the gas phase rises, while it drops in the liquid phase. This trend holds in both 2-phase and 3-phase separations. Why does this happen?
The answer lies in H₂S's high flash point pressure of 291 psig. At 80°F and 0 psig, H₂S primarily exists in the gas phase. In simpler terms, H₂S prefers the gas phase, although not as much as lighter gases like methane or ethane.
In contrast, heavier compounds like pentane, hexane, and heptane, which usually end up in crude oil tanks, have much lower flash points. At 80°F, pentane’s flash point is -4.2 psig, hexane’s is -11.7 psig, and heptane’s is -13.8 psig. At atmospheric pressure (0 psig), these compounds mostly stay in the liquid phase.
Most of the H₂S ends up in the gas phase because of its lower molecular weight and tendency to remain in gas form as pressure decreases. As pressure drops, H₂S flashes into the gas phase more easily than it dissolves in the liquid. Since H₂S has lower solubility in the liquid phase compared to heavier hydrocarbons, it concentrates in the gas phase as pressure decreases, while its presence in the liquid phase lessens.
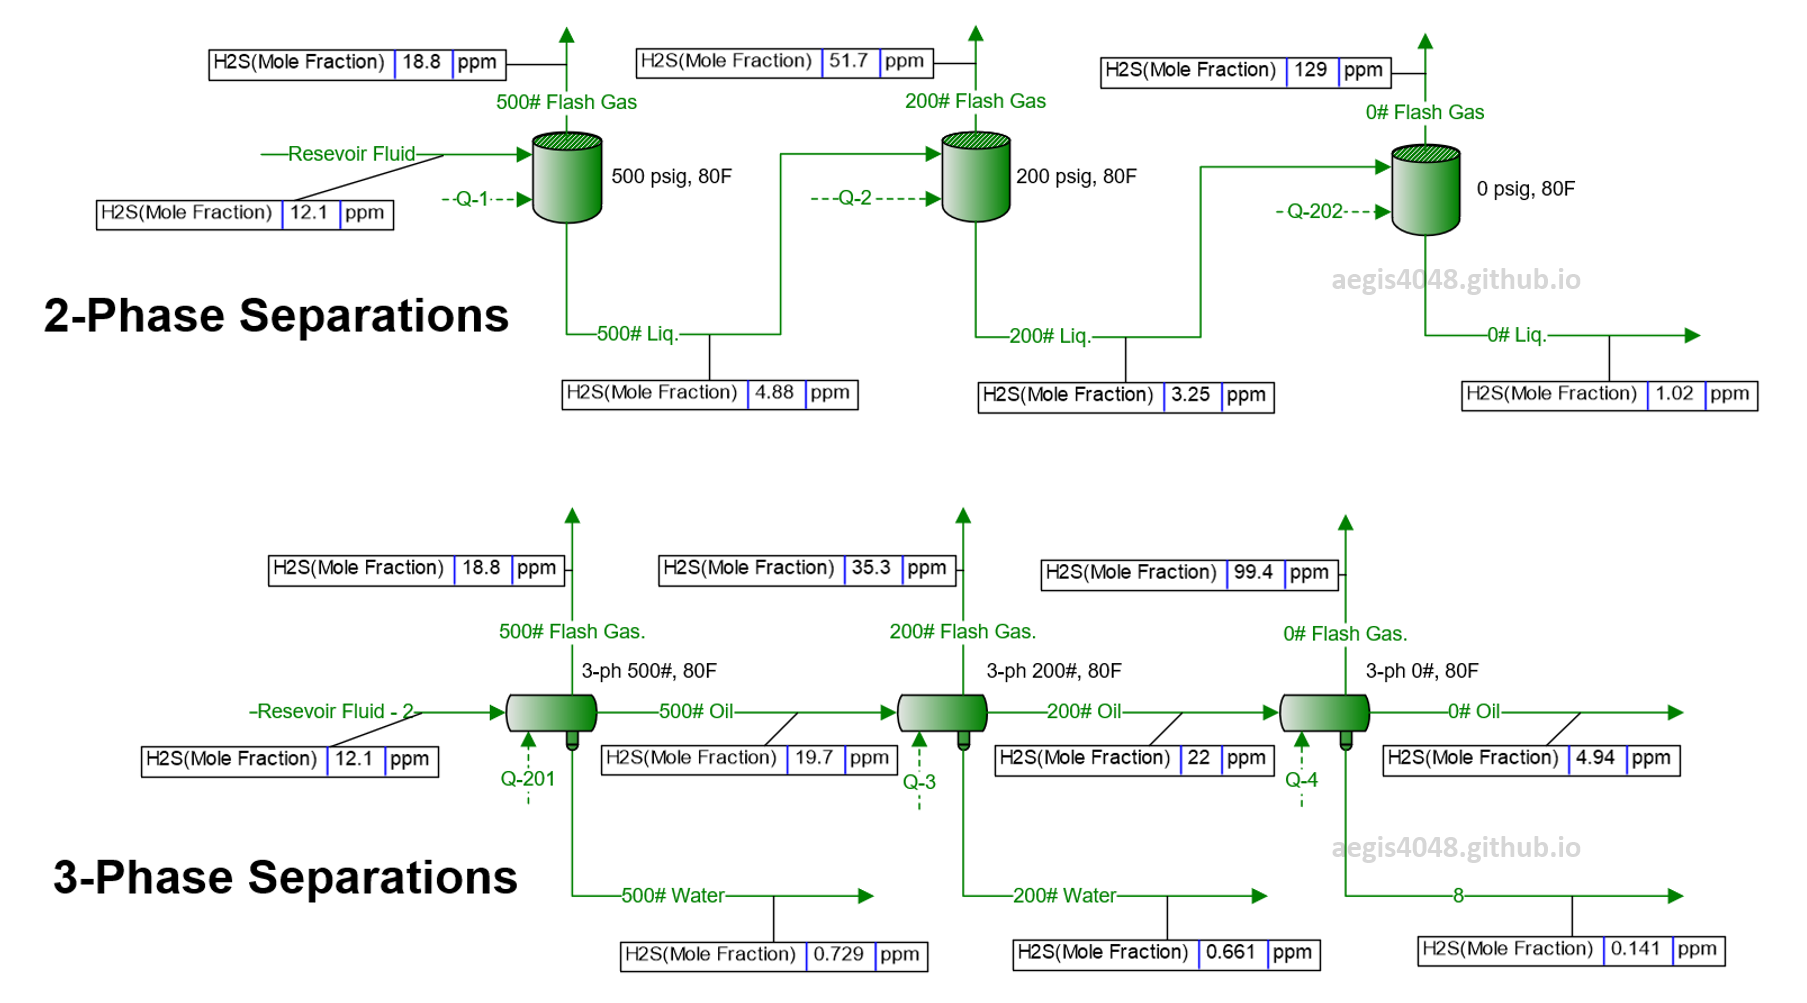
Figure 6: Simulation of an upstream facility where reservoir fluid is separated through 3 vessels, modeled using BR&E Promax. The reservoir fluid composition represents real well fluid properties. The simulation shows two key results: 1) H₂S levels are higher in the gas phase than in the liquid phase, and 2) H₂S concentrations increase in the gas phase as separation progresses, while they decrease in the liquid phase. This phenomenon is due to H₂S's high flash point pressure and its preference to flash into the gas phase rather than dissolve into the liquid phase.
4. H₂S sim results at various production rates¶
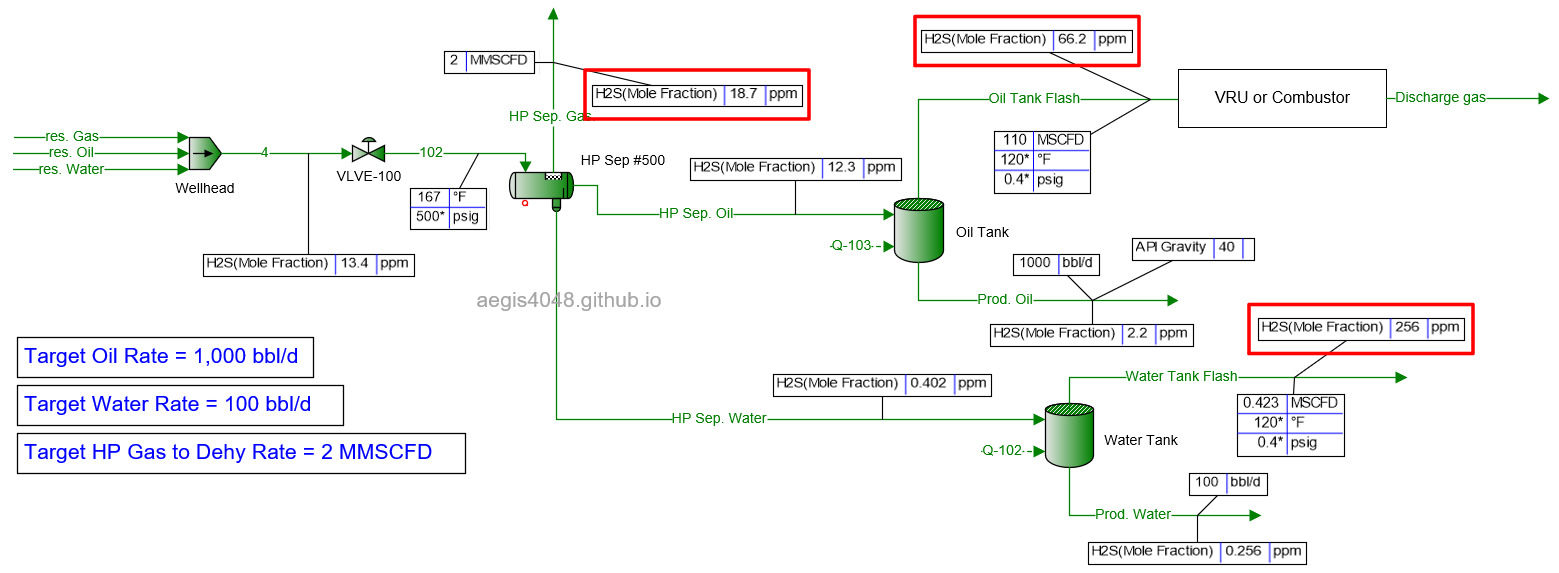
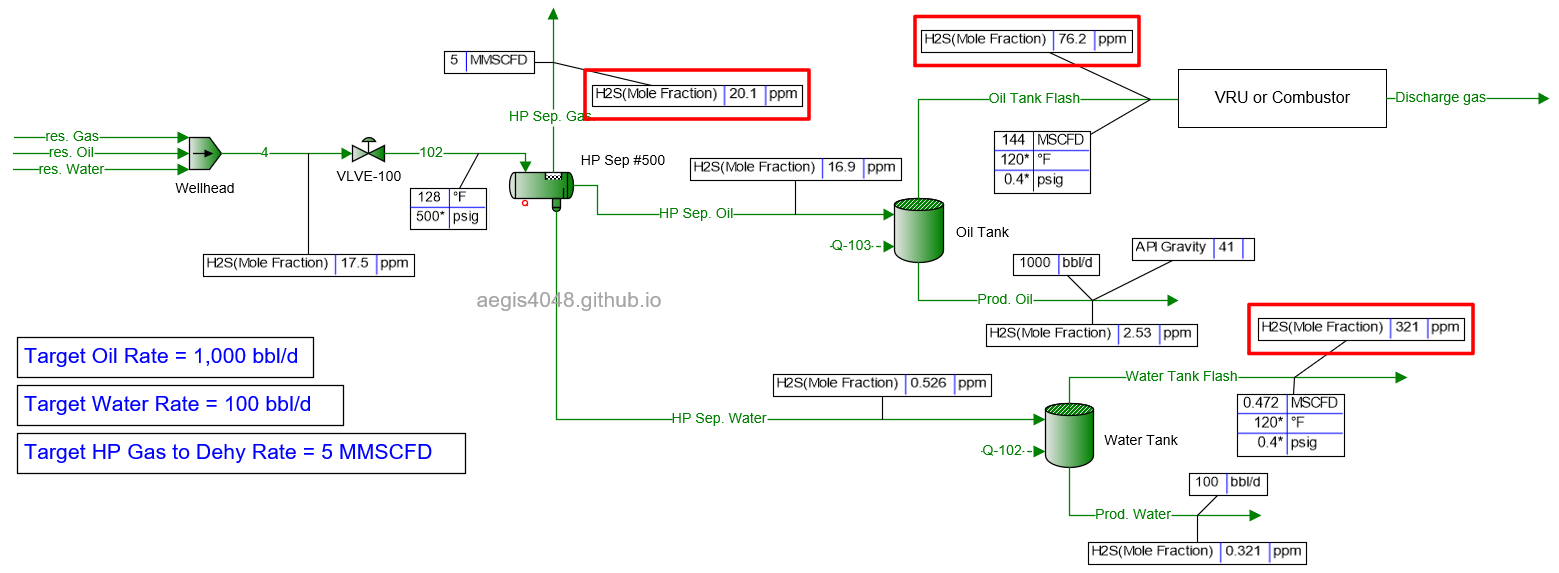
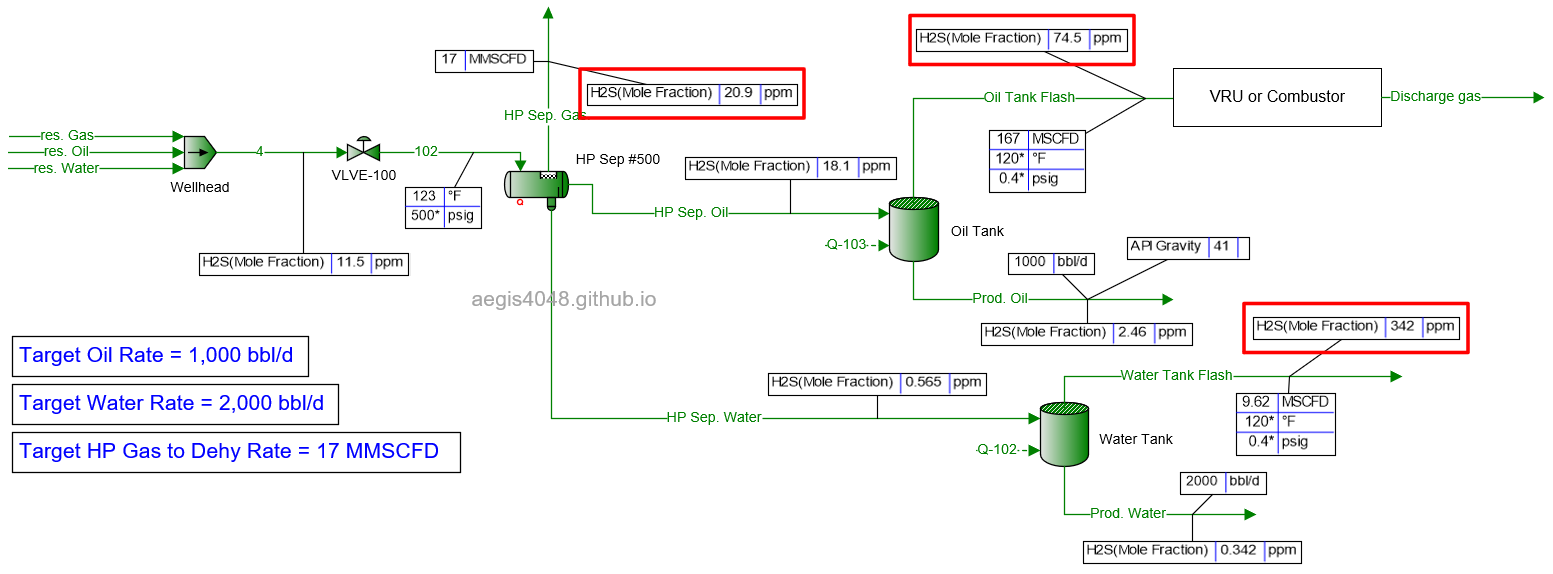
In Figure 1 above, H₂S increased from 20 ppm to 60 ppm at oil tank flash, and 300 ppm at water tank flash. This scenario was assuming 1000 BOPD, 500 BWPD, 5 MMSCFD production. How would the ppm values change at different production rates? I provide Promax sim result screenshots in this section for readers to observe and learn. For all scenarios, oil prod is fixed at 1000 BOPD. Water rate ranges between 100 to 2000 BWPD, and gas rate ranges from 2 MMSCFD to 20 MMSCFD. Oil gravity is assumed to be 40° API (impact of API gravity didn't seem to be much after running some simulations).
4.1. Simulation screenshots¶
For summary, navigate down to 4.2. Simulation results summary.
4.1.1 100 BWPD¶
2 MMSCFD
5 MMSCFD
10 MMSCFD
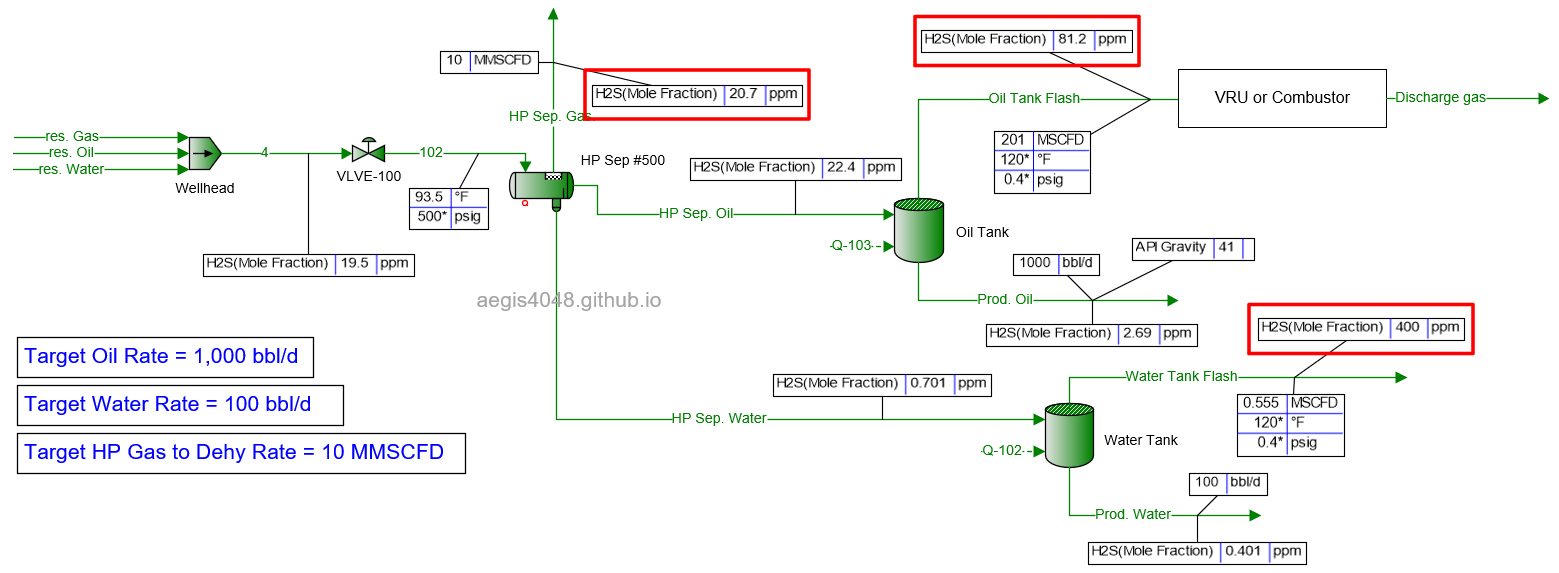
20 MMSCFD
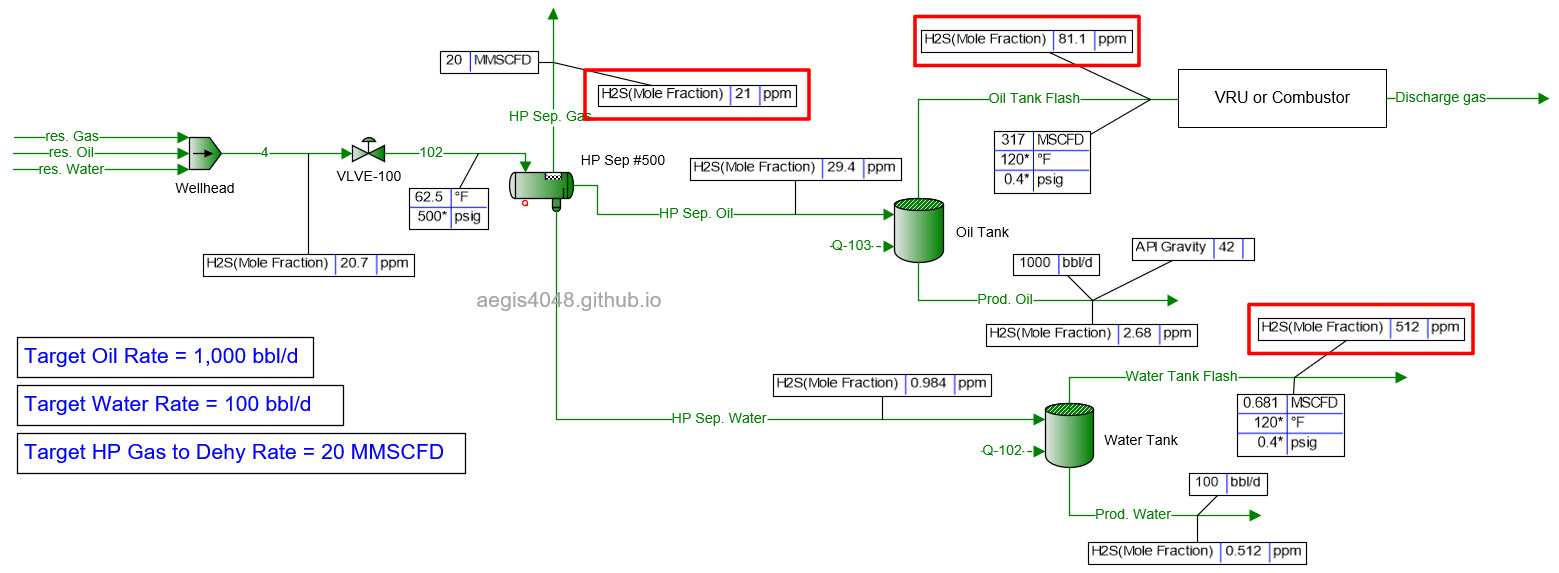
4.1.2 1000 BWPD¶
2 MMSCFD
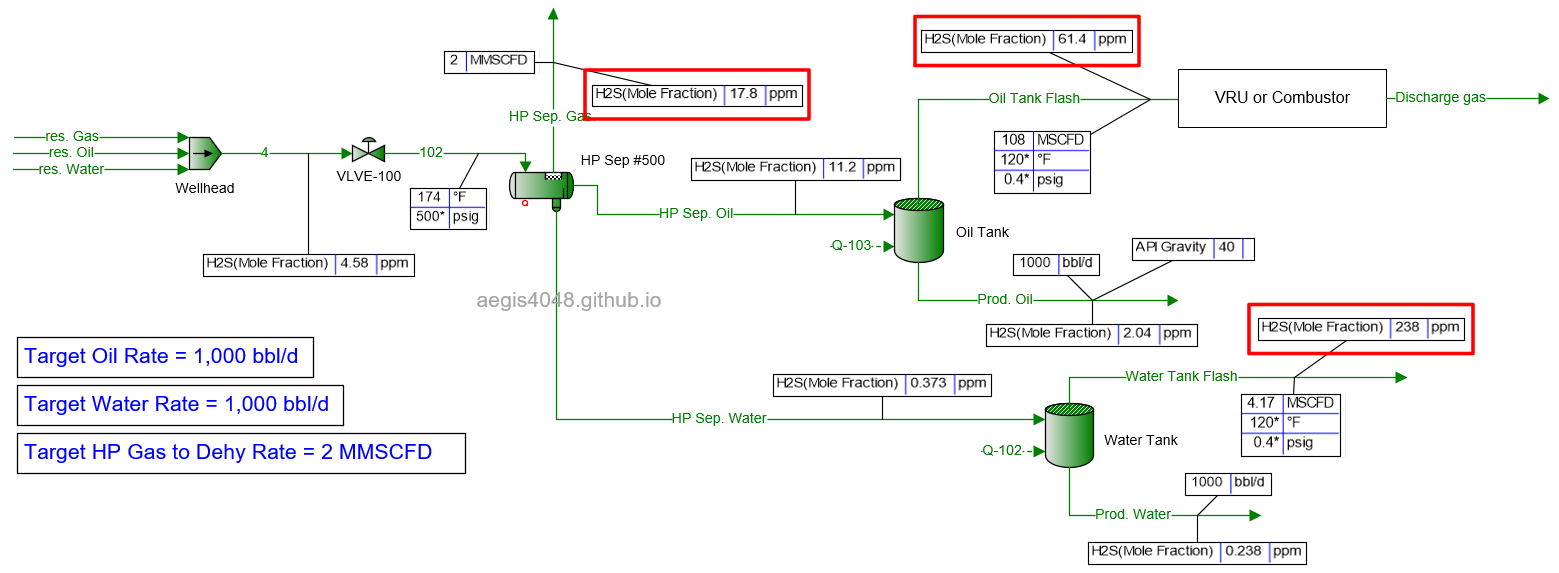
5 MMSCFD
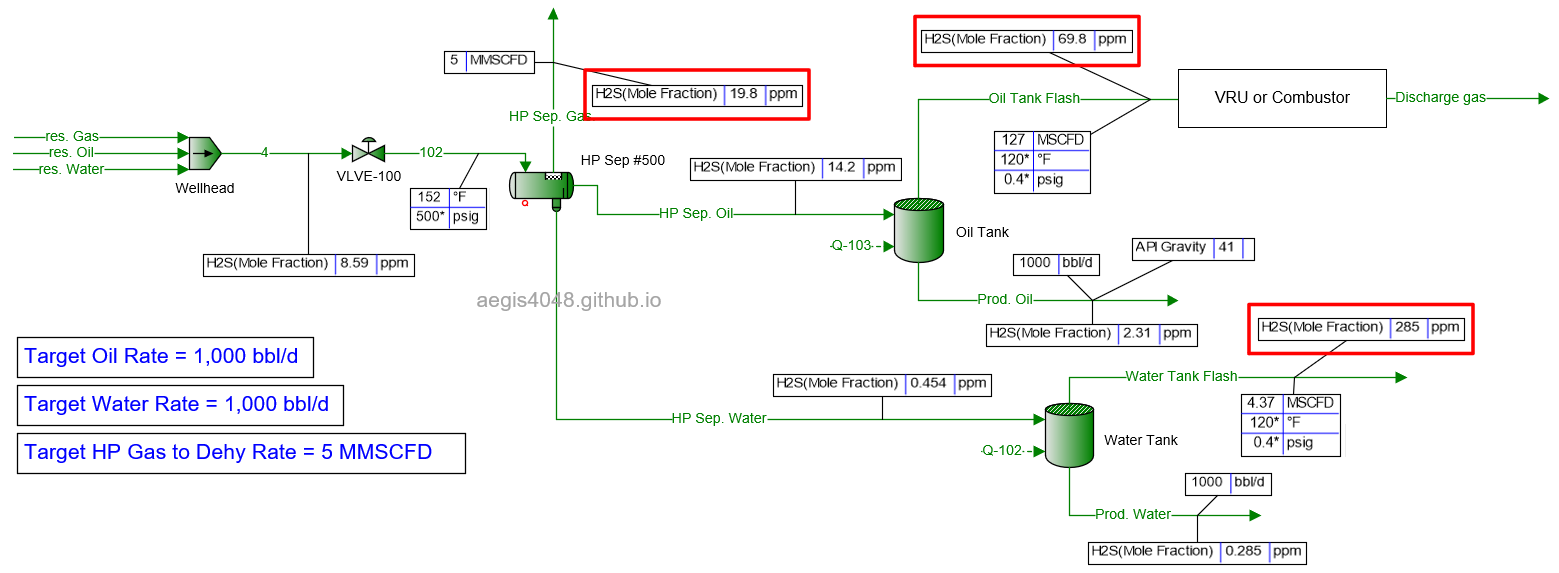
10 MMSCFD
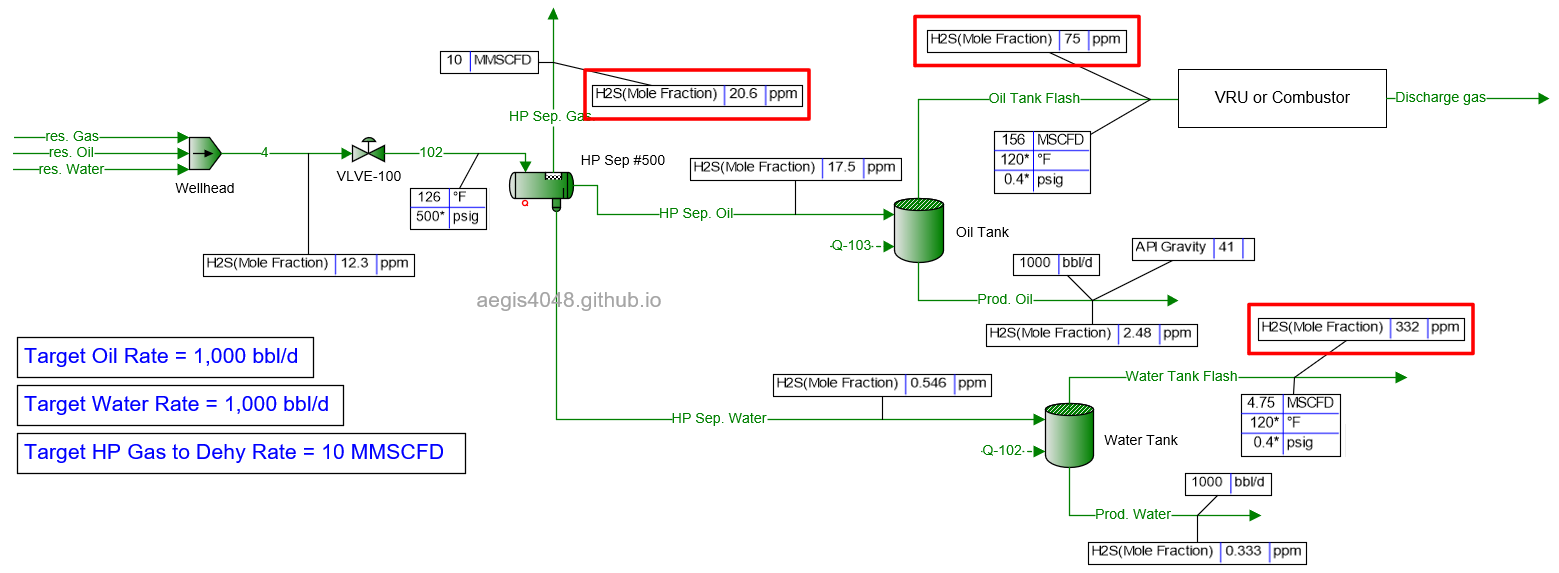
20 MMSCFD
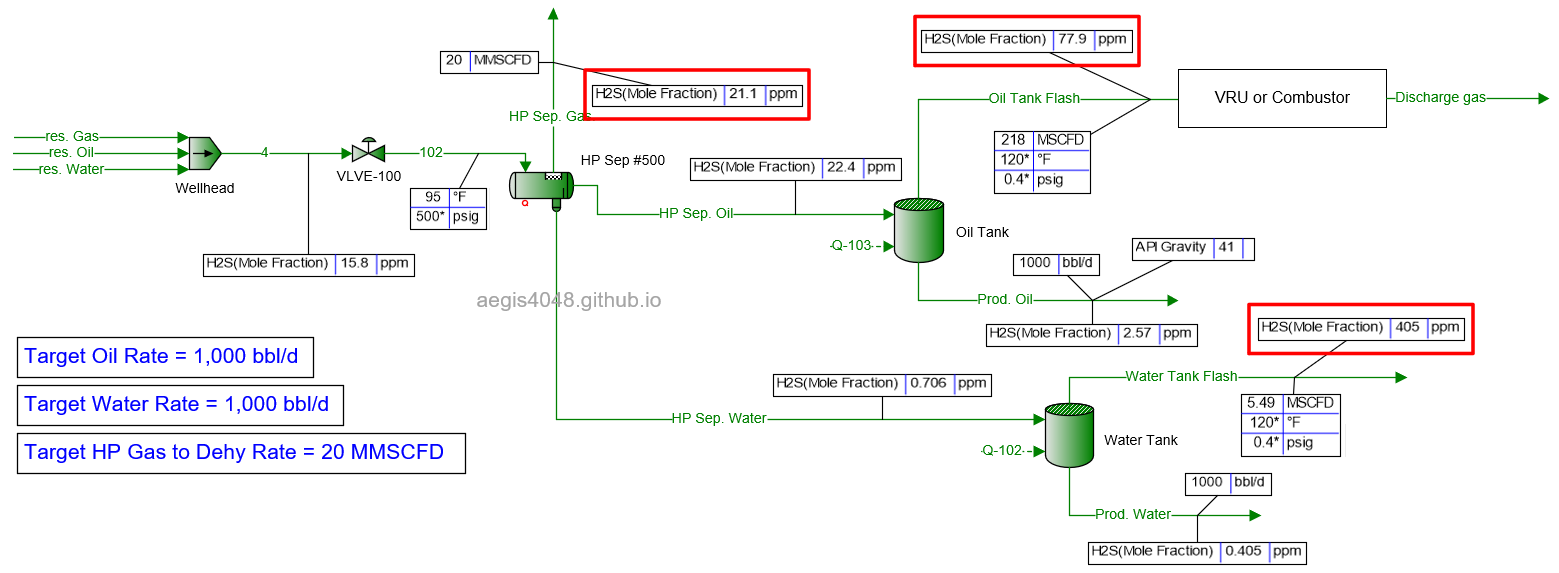
4.1.3 2000 BWPD¶
2 MMSCFD
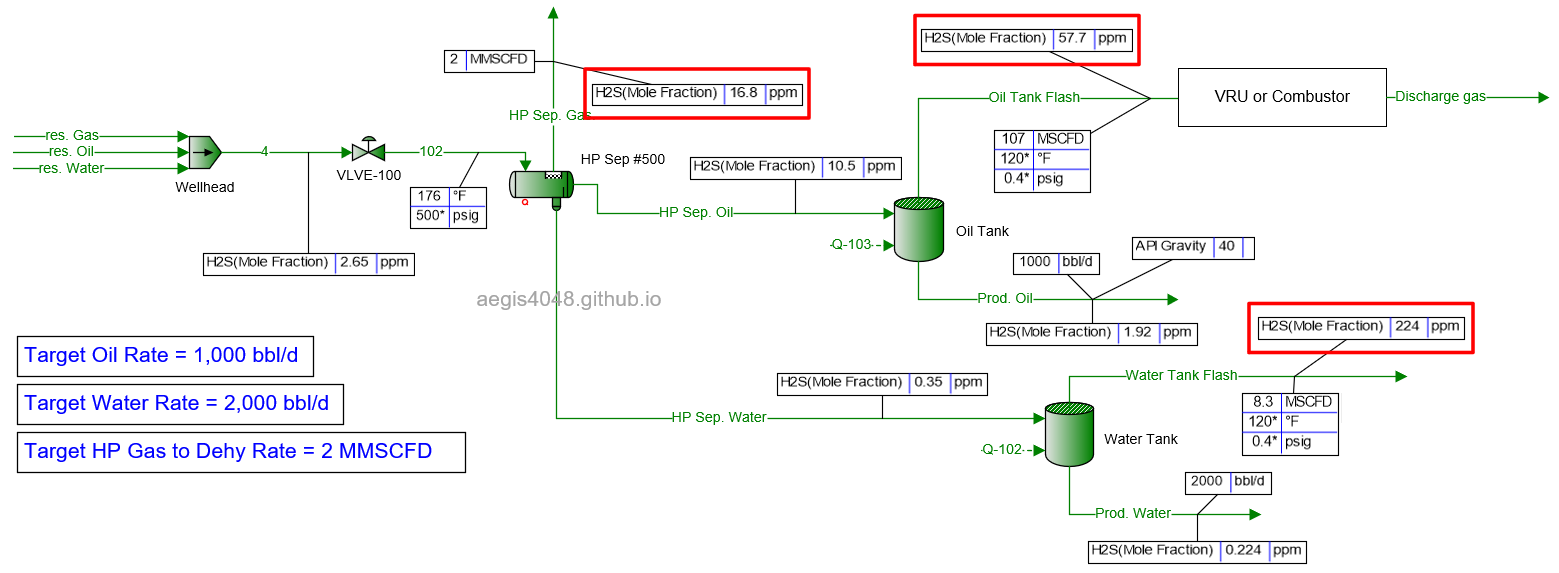
5 MMSCFD
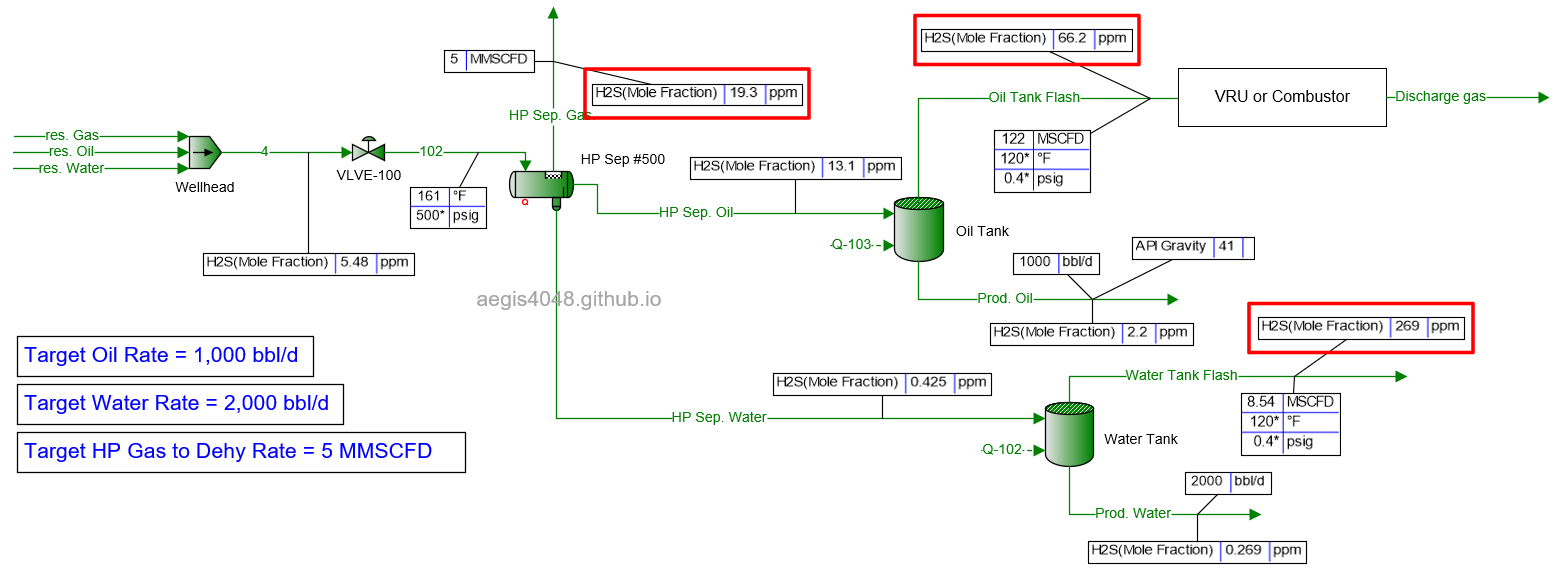
10 MMSCFD
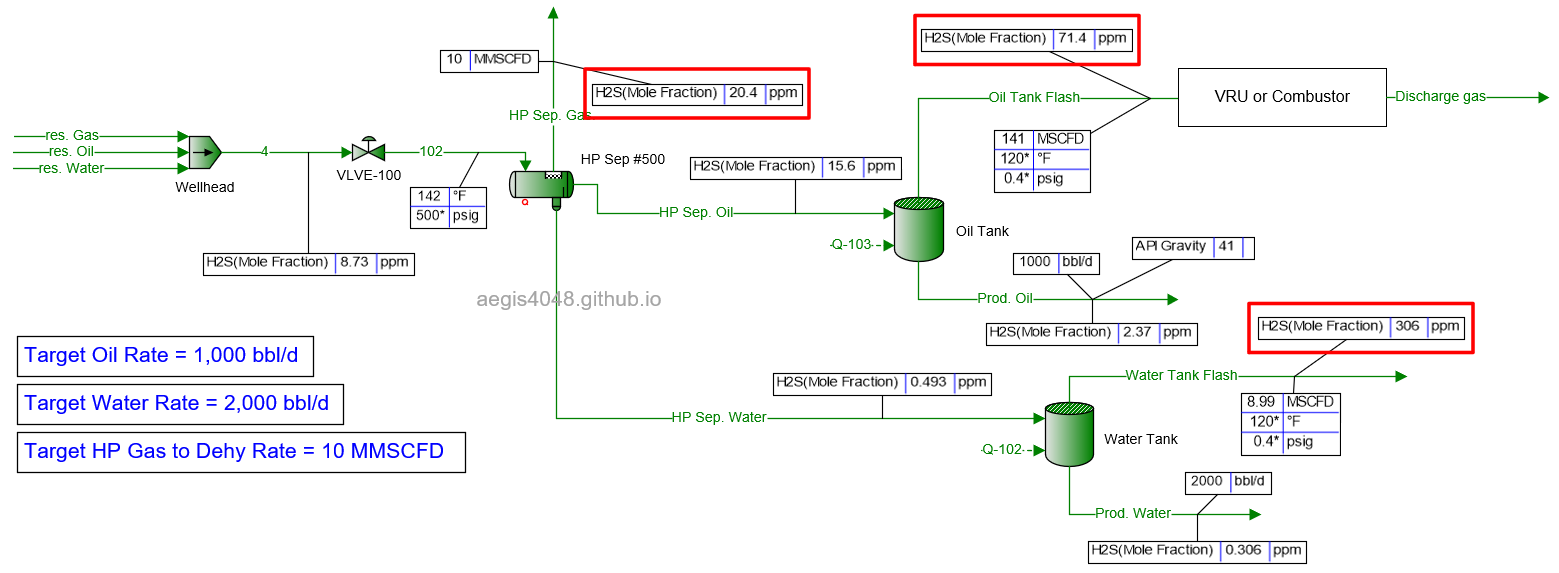
17 MMSCFD *
Simulated failed and could not be converged beyond 17 MMSCFD mark, so 17 MMSCFD is reported here instead of 20.
4.2. Simulation results summary¶
Table 2 shows the simulated H₂S ppm levels at various production rates across different process streams. Table 3 is a normalized version of Table 2, allowing for easier comparison of how H₂S ppm levels measured at high-pressure conditions change at lower-pressure conditions. Normalization was necessary because H₂S ppm levels at the 500# separator’s gas side fluctuate as production rates (BOPD, BWPD, MMSCFD) change.
Four key conclusions can be drawn from Table 3:
1. H₂S ppm levels measured at high-pressure applications should not be used for low-pressure applications due to significant discrepancies.
2. These discrepancies are more pronounced in water tank flash gas than in oil tank flash gas. For oil tank flash gas, H₂S levels were 2.5 times higher than in the separator gas, whereas for water tank flash gas, the difference was 13–24 times greater. Stricter standards should be applied for water tank flash lines.
3. Increasing the Gas-Oil-Ratio (GOR) raises ppm levels to a certain extent in lower-pressure applications, increasing the deviation from high-pressure separator measurements. However, high GOR results in only ~10% higher H₂S ppm compared to low GOR, and the effect of GOR on H₂S ppm is minimized in high watercut applications.
4. An increase in water cut slightly reduces H₂S levels, but the effect is minimal.
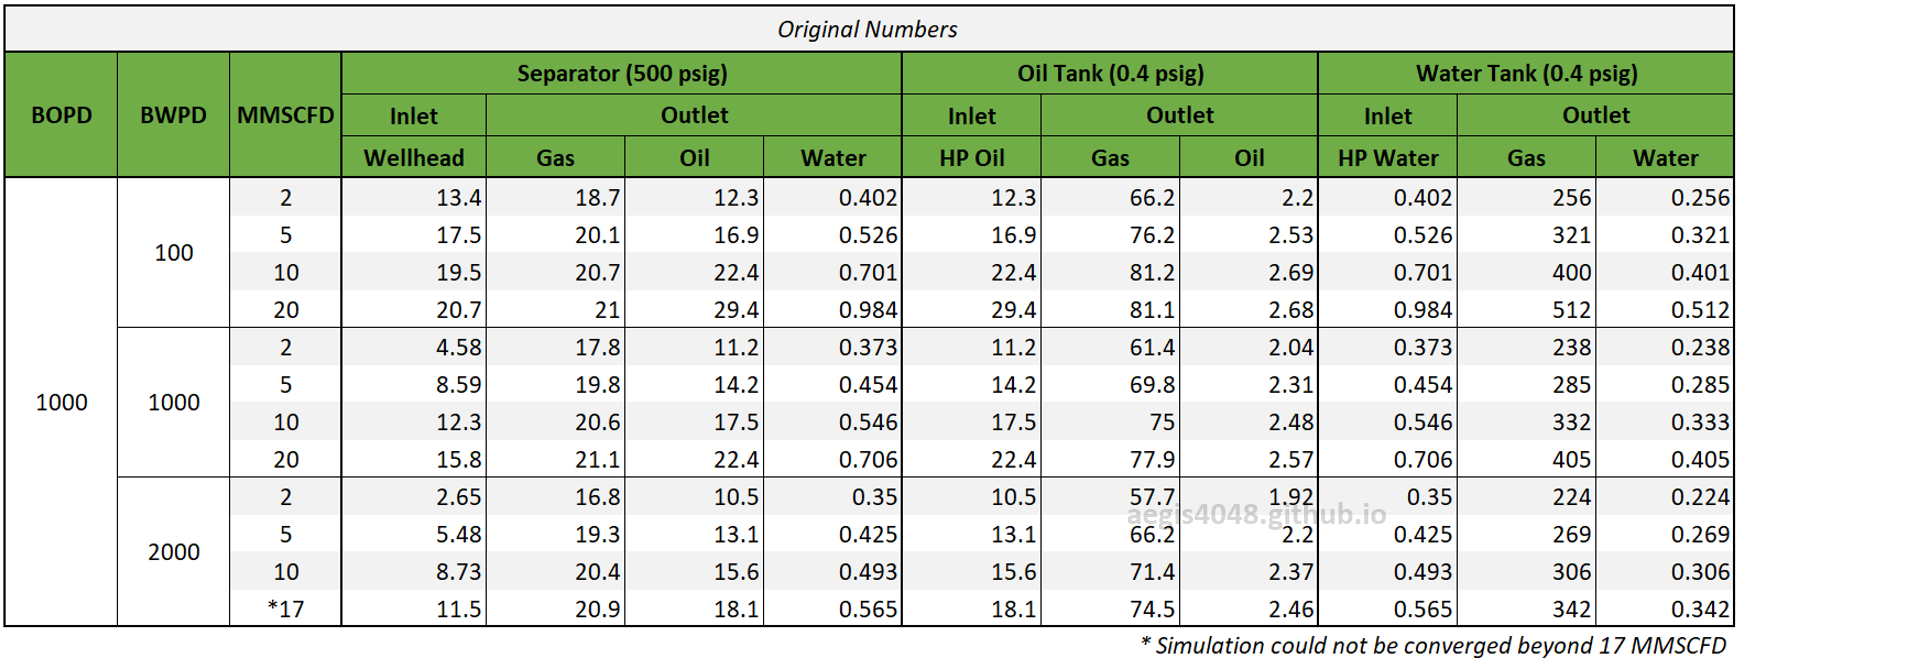
Table 2: H₂S ppm levels reported at various process streams and production rates, taken from simulation results shown in 4.1. Simulation screenshots above.
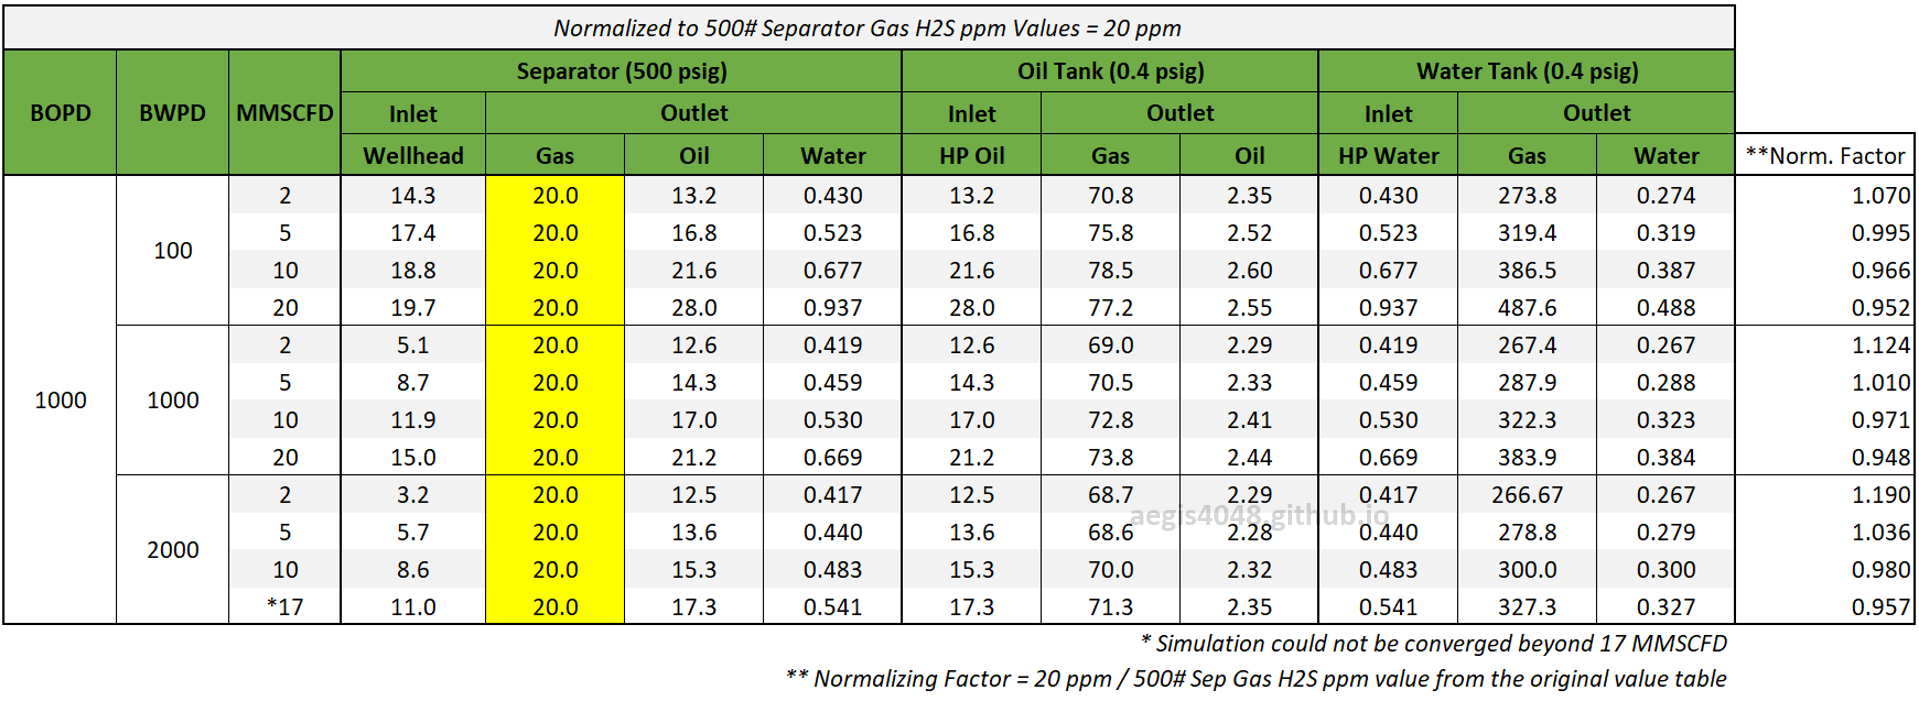
Table 3: Normalized version of Table 2. All simulated ppm values were multiplied by a normalizing factor so that the H2S ppm levels taken at the 500# separator's gas side equals 20 ppm in all scenarios.
5. Conclusion¶
1. H₂S ppm levels are important to comply with regulations, prevent equipment damage, and ensure personnel safety.
2. H₂S ppm levels measured in high-pressure applications should not be applied to low-pressure environments, as the compositions change during separation at lower pressures.
3. H₂S ppm levels significantly increase at low pressure. For example, in Figure 1, 20 ppm measured at the 500# separator rises to 63.4 ppm and 302 ppm at the atmospheric oil and water tank flash lines, respectively.
4. H₂S levels increase as lighter ends (methane and ethane) flash off before (and more) H₂S enters the gas phase. This occurs because methane (MW=16.04) and ethane (MW=30.07) are lighter than H₂S (MW=34.08), giving them higher flash point pressures, as shown in Figure 5. However, methane is the main driver, as it flashes significantly easier than ethane (shown in Figure 4 and Table 1), leaving a higher concentration of H₂S in lower-pressure vessels.
5. H₂S levels are much higher in gas streams than in liquid streams because H₂S has a high flash point pressure of 291 psig (at 80°F) and prefers the gas phase. As pressure drops, H₂S flashes into the gas phase more readily than it dissolves into the liquid.
6. Discrepancies between high- and low-pressure ppm levels are more pronounced in water tank flash gas than in oil tank flash gas. For oil tank flash gas, H₂S levels were 2.5 times higher than in the 500 psig separator gas, whereas for water tank flash gas, the difference was 13–24 times greater (shown in Table 3). Stricter safety and corrosion standards should be applied for water tank flash lines.
7. The impact of GOR and water cut is minimal. The main factor is the compositional changes due to pressure drop and flashing.
