gascompressibility.quickstart#
- quickstart(zmodel='DAK', prmin=0.2, prmax=30, figsize=(8, 5), title_bold=None, title_plain=None, title_underline_loc=0.93, disable_tr_annotation=False, **kwargs)[source]#
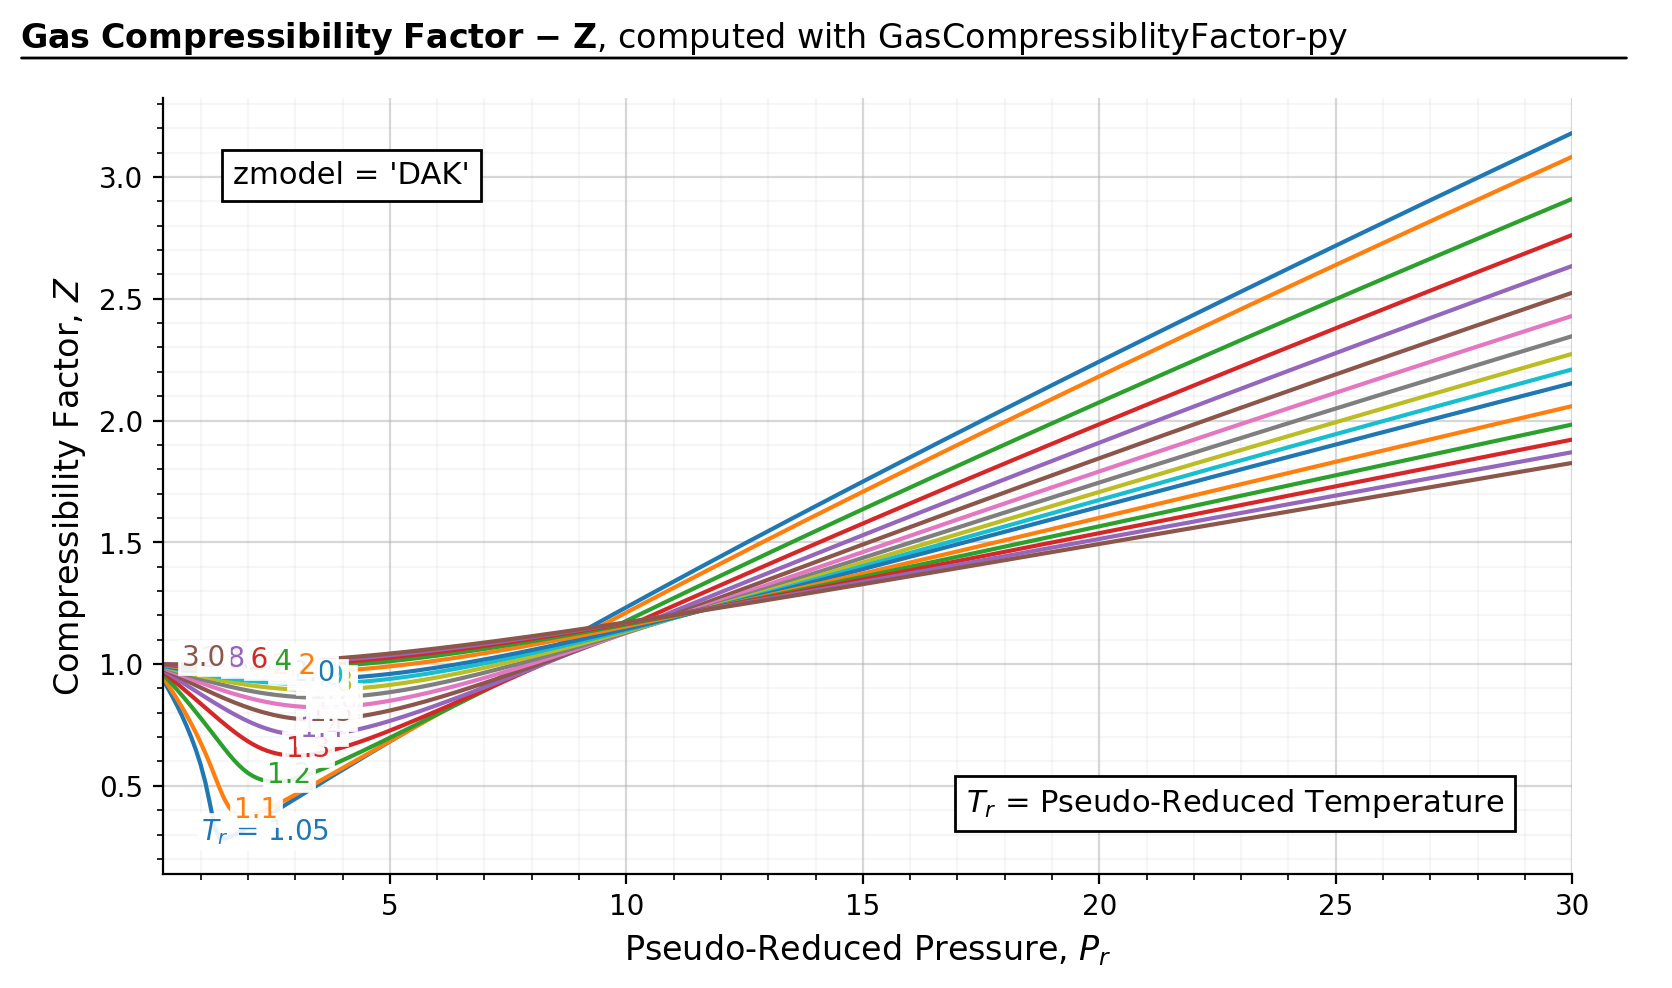
Quick plot generation tool for those who don’t wish to write a full-blown matplotlib script. It generates a z-factor correlation plot against \(P_r\) and \(T_r\) ranges.
Basic usage
>>> import gascompressibility as gc
>>>
>>> result, fig, ax = gc.quickstart()
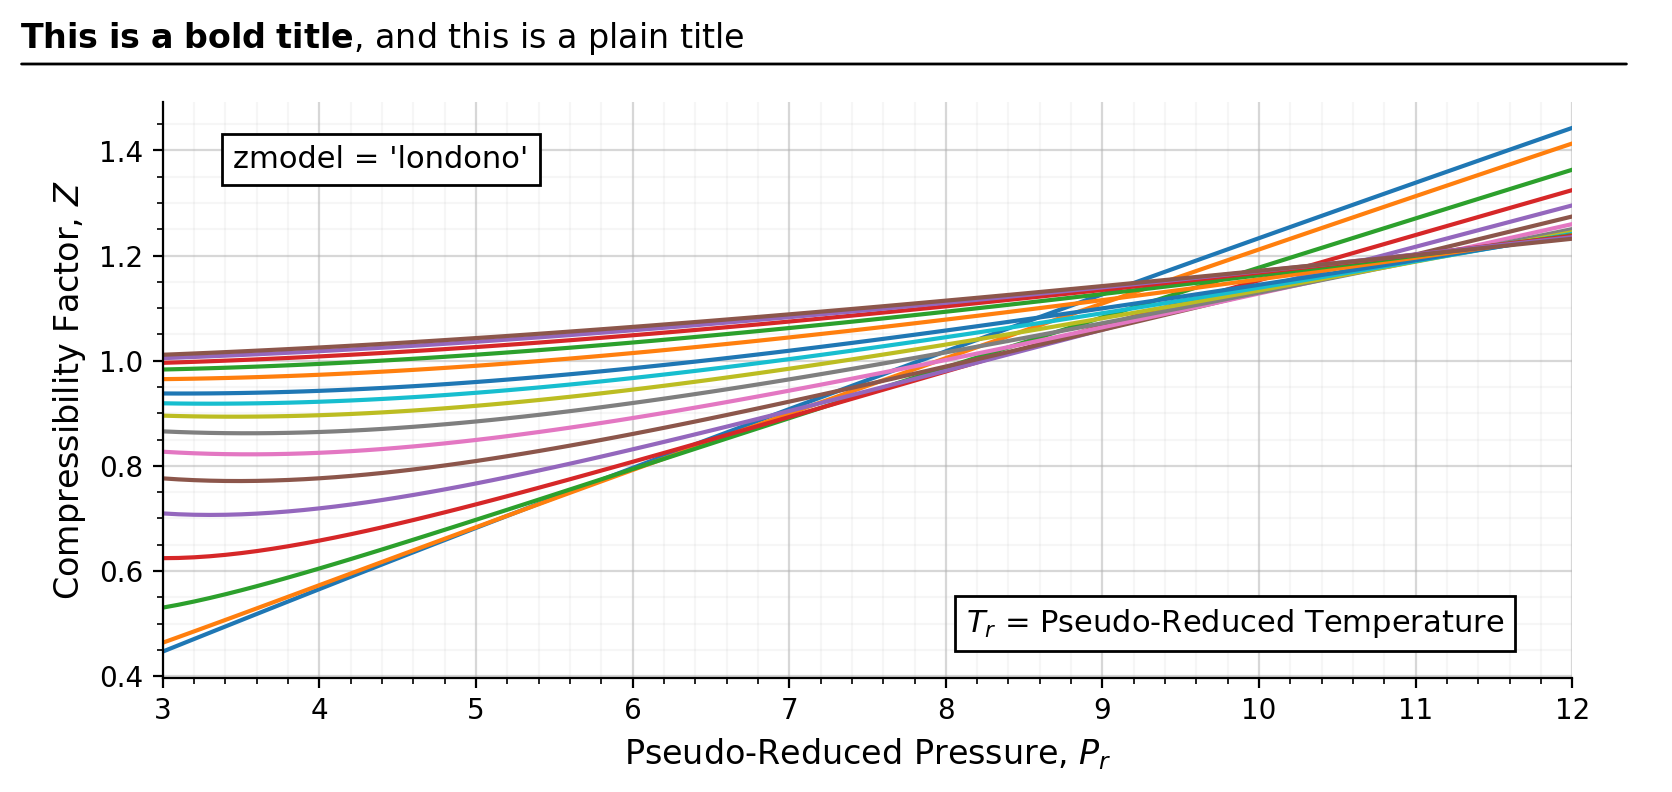
Built-In Parameter Tweaks
>>> result, fig, ax = gc.quickstart(
...     zmodel='londono', prmin=3, prmax=12, figsize= (8, 4),
...     title_underline_loc=0.91, disable_tr_annotation=True,
...     title_bold='This is a bold title', title_plain='and this a plain',
... )
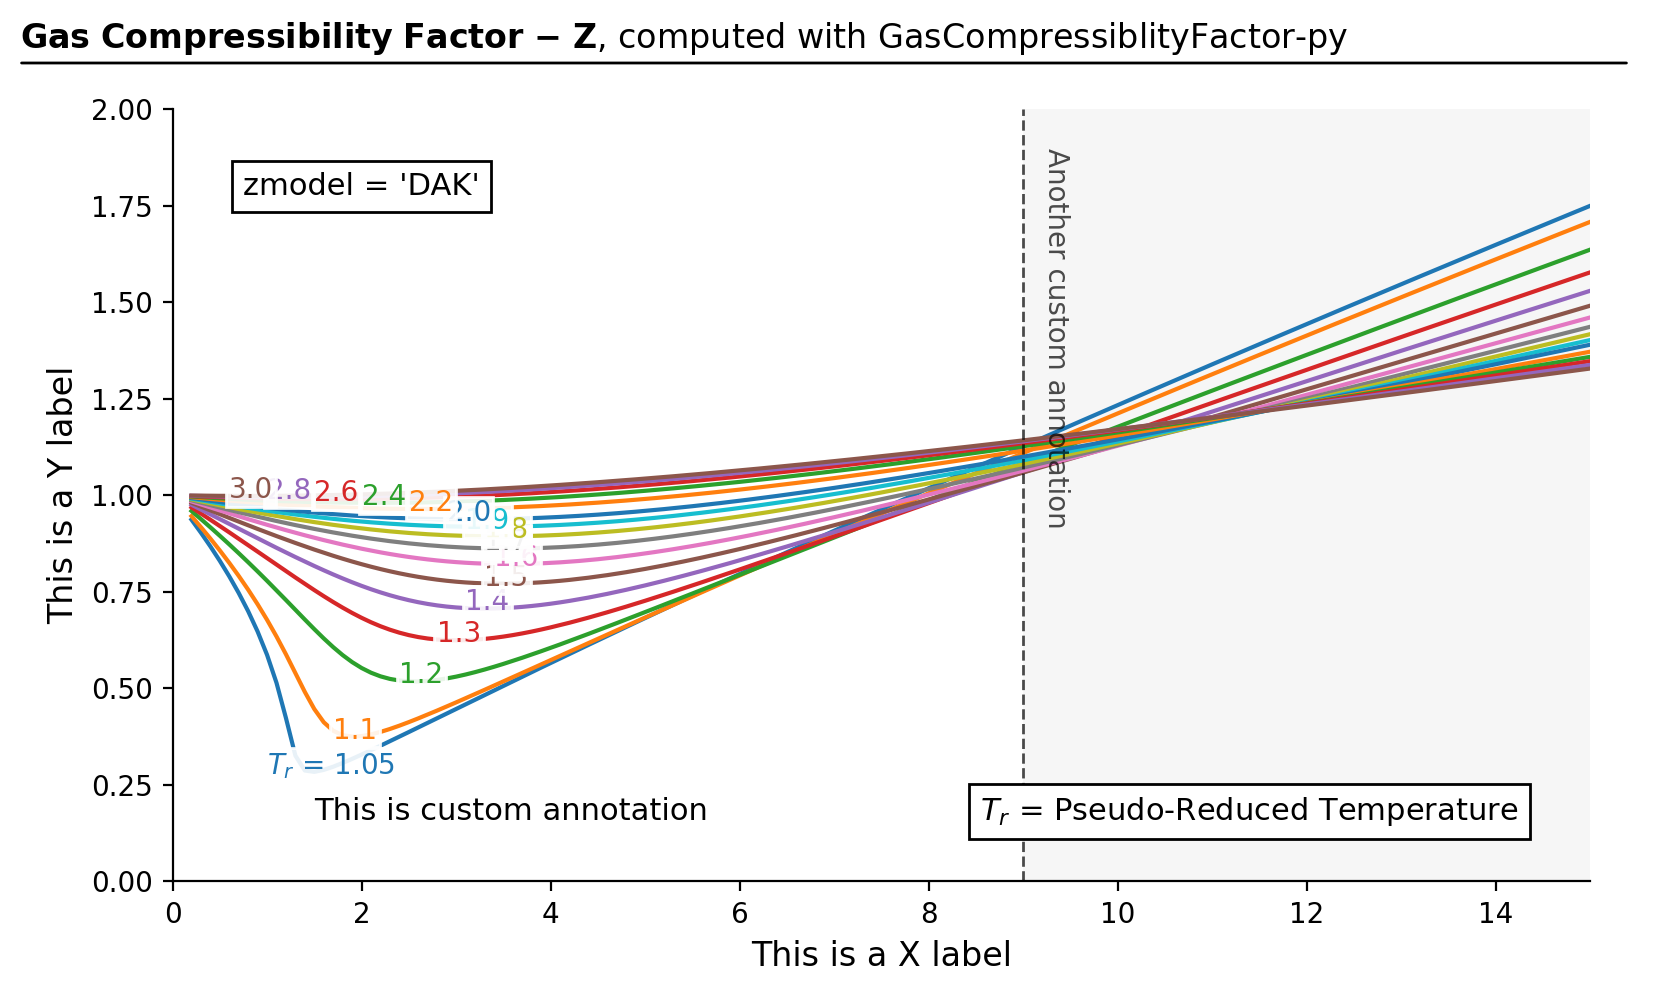
Custimization using the returned matplotlib axis object
>>> result, fig, ax = gc.quickstart()
>>>
>>> ax.set_ylim(0, 2)
>>> ax.set_xlim(0, 15)
>>> ax.set_ylabel('This is a Y label')
>>> ax.set_xlabel('This is a X label')
>>> ax.grid(False)
>>> ax.minorticks_off()
>>> ax.text(0.1, 0.08, 'This is custom annotation', fontsize=11,
... transform=ax.transAxes)
>>> ax.axvspan(9, 15, facecolor='#efefef', alpha=0.5)
>>> ax.axvline(x=9, color='k', linestyle='--', linewidth=1, alpha=0.7)
>>> ax.text(9.2, 1.9, 'Another custom annotation', fontsize=10, va='top',
... color='k', alpha=0.7, rotation=270)
>>>
>>> fig.tight_layout()
>>> # fig.savefig('output.png', bbox_inches='tight', dpi=200)
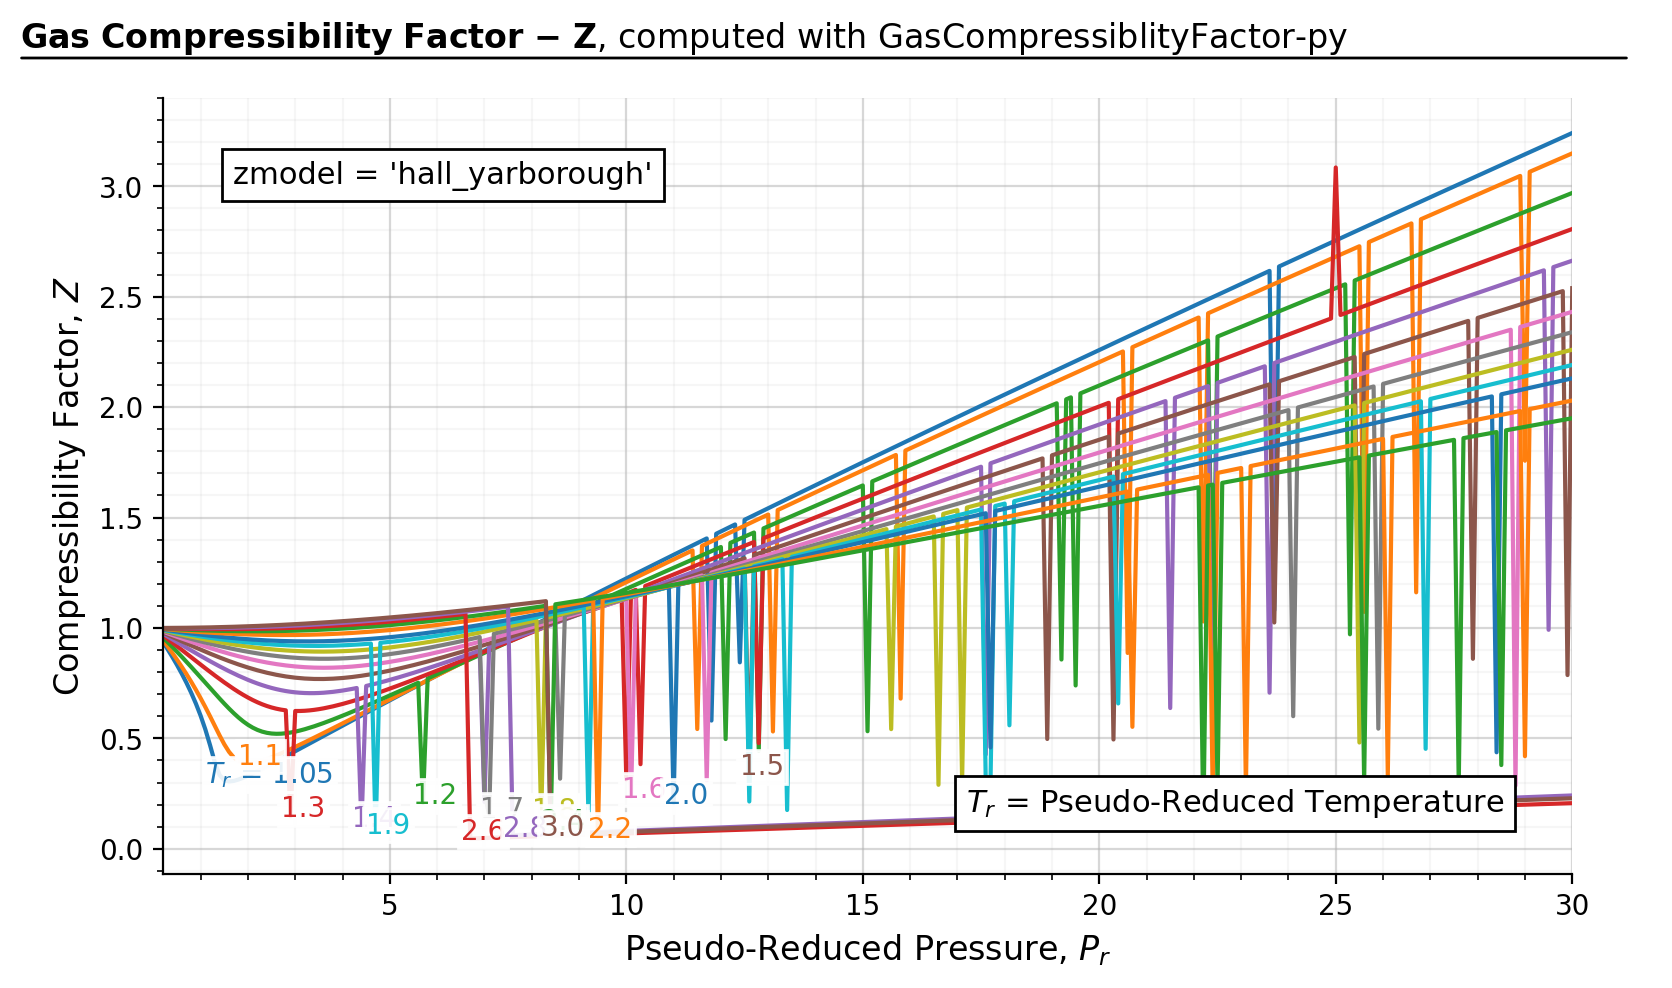
Extreme failure scenario when
smart_guess=Falseand badguessis provided - NOT RECOMMENDED. Check Theories 2.6: Caveats for more information.>>> results, fig, ax = gc.quickstart(zmodel='hall_yarborough', prmin=0.2, prmax=30, ... smart_guess=False, guess=0.1)
- Parameters:
zmodel (str) – choice of a z-correlation model. Check Theories 2: Z-Factor Correlation Models for more information. Accepted inputs:
'DAK'|'hall_yarborough'|'londono'|'kareem'prmin (float) – minimum value of the \(P_r\) range
prmax (float) – maximum value of the \(P_r\) range
figsize (tuple) – matplotlib figure size
title_bold (str) – string of the bold (left) portion of the figure title
title_plain (str) – string of the plain (right) portion of the figure title
title_underline_loc (float) – vertical location of the horizontal bar under the title. Try adjusting this value between 0.8 ~ 1.10 if the title underline looks off
disable_tr_annotation (bool) – set this to
Trueto not display \(T_r\) text annotationskwargs (dict) – optional kwargs used py gascompressibility.calc_z.
- Returns:
results (dict) – dictionary of the simulation result. The structure is as follows:
>>> results
{
    1.05: {
        'Pr': array([0.2, 0.3, 0.4, ..., 29.9]),
        'Z': array([0.9367, 0.9030, 0.8675, ..., 3.1807]),
    },
    1.1: {
        'Pr': ...
        'Z': ...
    },
    ...
}
Each key: value pairs can be retrieved like this:
>>> Pr_105 = results[1.05]['Pr']
>>> Z_105 = results[1.05]['Z']
>>> Pr_110 = results[1.1]['Pr']
>>> Z_110 = results[1.1]['Z']
fig (Figure) – Matplotlib figure object
ax (Axis) – Matplotlib axis object